
Data and results
The data presented here is from testing a selection of primer sets found in the table at the previous page. Fragments amplified will be marked with the primer set # as given in the table. Most of the experiments are performed with native Taq produced at The Norwegian Radium hospital. The same Taq was made into Hotstart Taq by adding Taq specific antibody.
First test
Twelve primer sets was first test with commercial chemistry in a two-step setup. First a 100µl cDNA synthesis was performed followed by real-time PCR. cDNA was made in 100µl reaction volume with the following components; 20µl 5X qScriptTM Reverse, 10µl virus RNA, 5µl reverse transcriptase and 65µl H20. The mix was subjected to 22°C 5min, 42°C 30min and 85°C 2 minutes. The 10µl real-time PCR mix was made of 0.45µM of each primer, 5µl 2XPerfeCTa, 1µl cDNA and 4µl H2O. The cycling was started with a initial denaturation for 30 seconds (sec) followed by 95°C 15 sec 50°C 20 sec and 72°C 40 sec. After each cycle the fluorescent signal was recorded. Please note that the PerfeCTa mix does not allow for use of TaqMAN probes labeled with 6-Carboxyfluorescein (FAM).
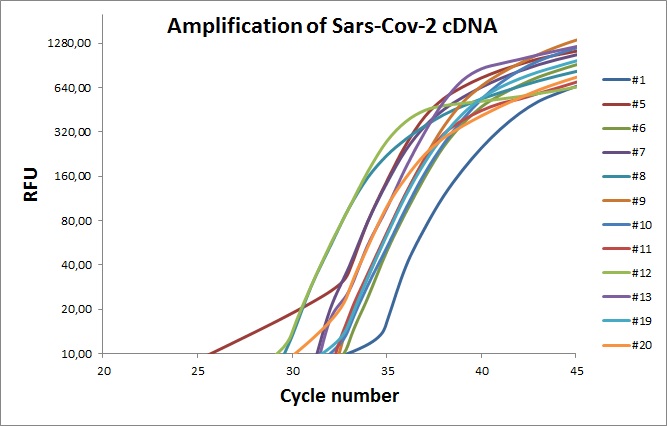
Each curve is the average of 7 technical replicates. The colored line represents different primers sets.
Second test
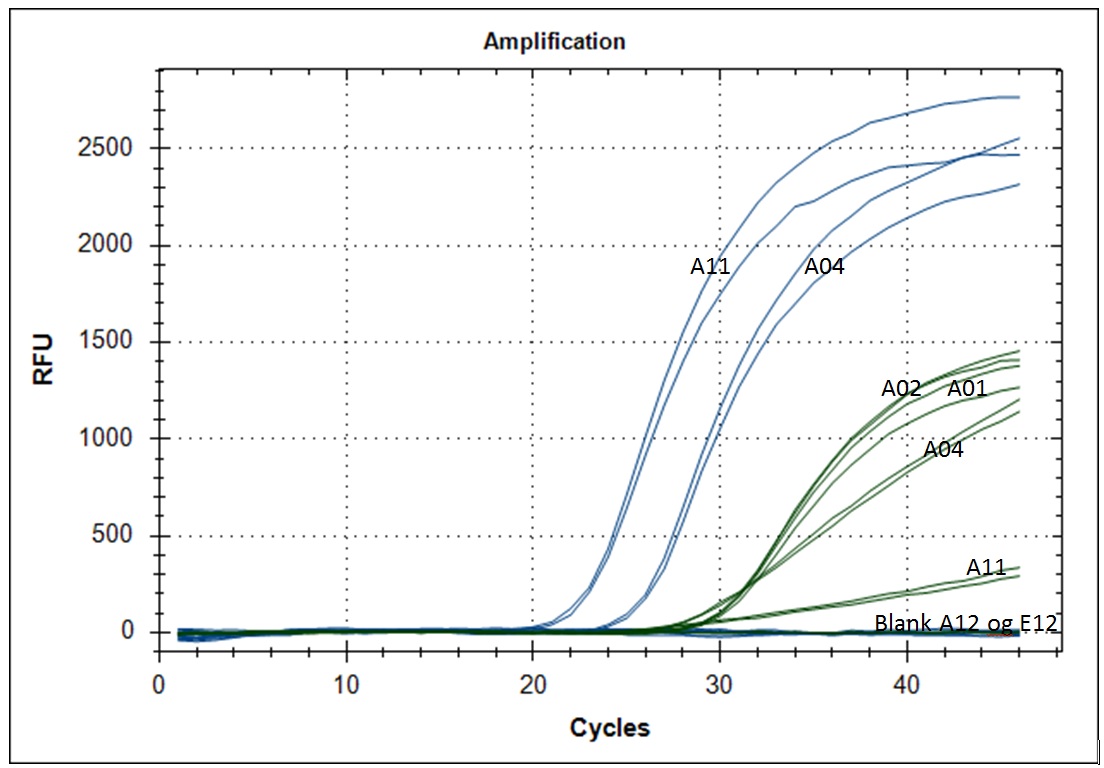
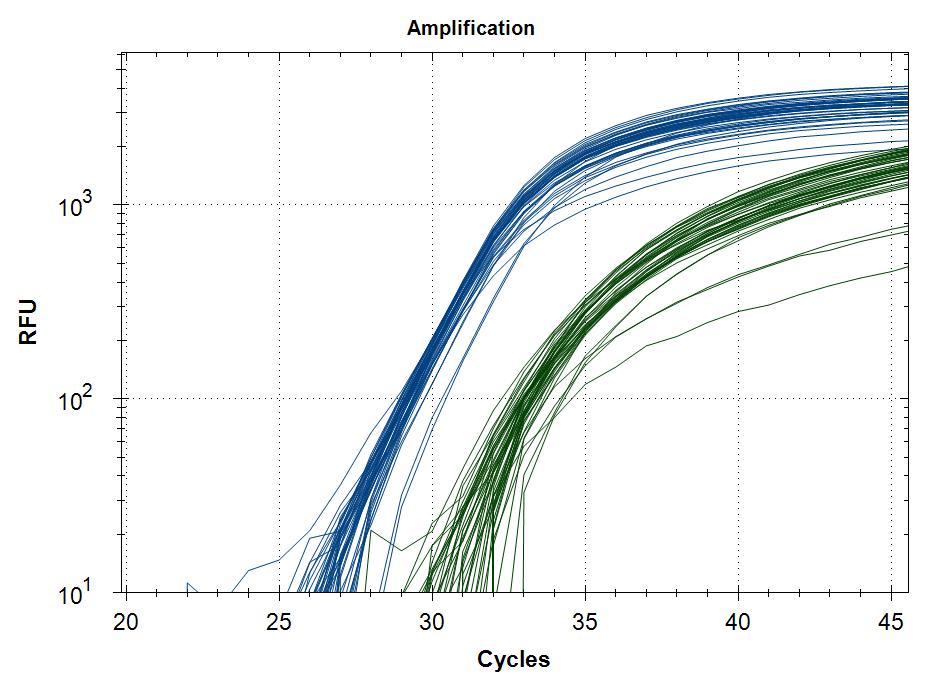
Next test was to introduce Mashup (in-house produced reverse transcriptase) in combination with commercial chemistry. The Mashup was serial diluted in the cDNA reaction mixture to determine the apparent “units” of the enzyme, followed by real-time PCR. Example below is the amplification curves for primer set #5.
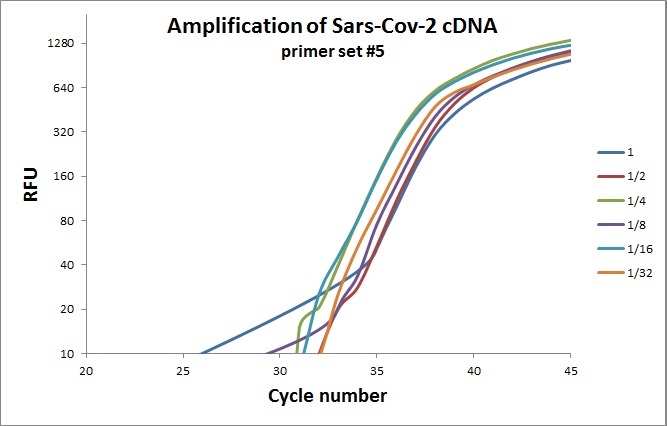
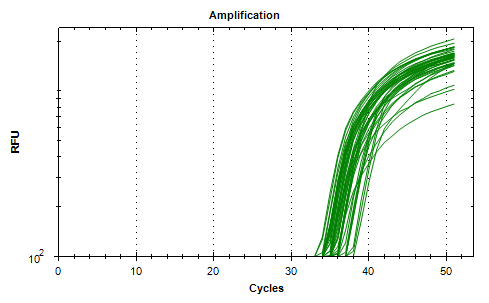
Representative amplification curves of cDNA template made with different number of units of MashUp. Green curves all technical replicates.
In-house cDNA chemistry
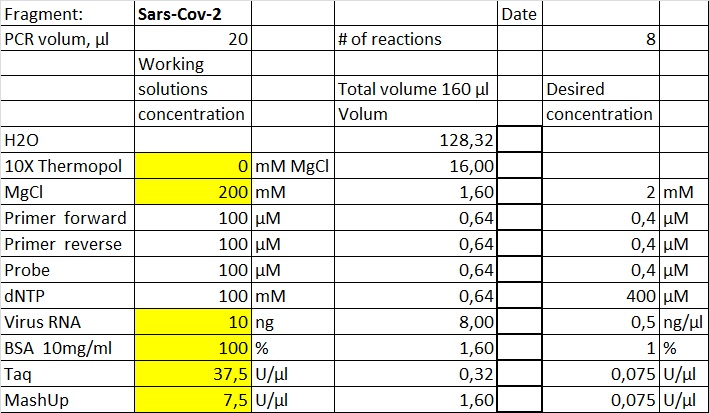
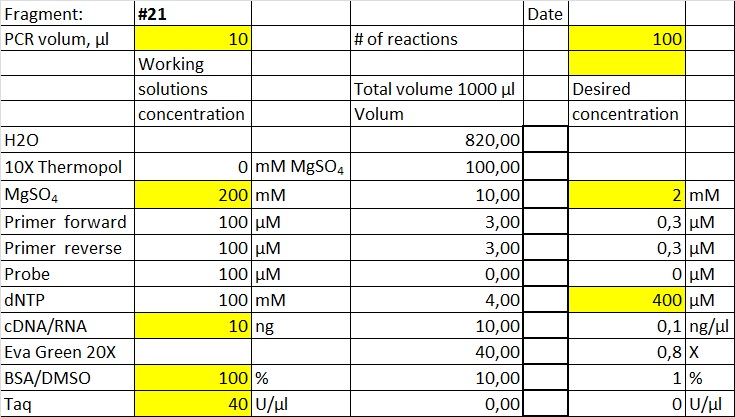
First attempt to use in-house chemistry for the cDNA synthesis was performed with the following recipe. 20 µl 10X Thermopol (w 20mM MgSO4), 10µl RNA, 1µl dNTPs (100mM), 1µl BSA (10mg/ml), 66µl H20 and 1µl reverse primers (from 12 primer sets, 100µM) and 1µl MashUp (reverse transcriptase). The mix was subjected to 22°C 5min, 42°C 30min and 85°C 2 minutes.
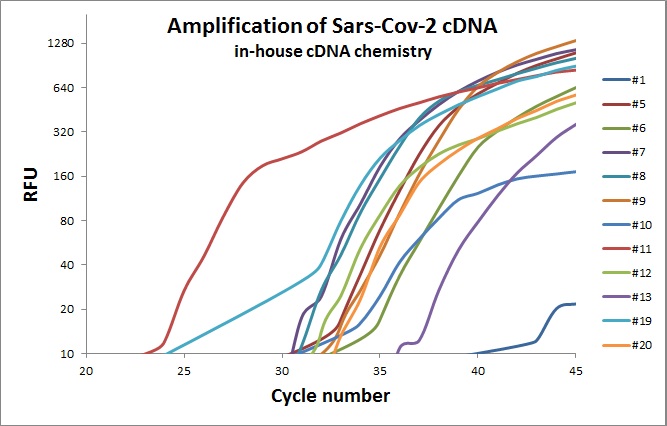
The graph above indicates that cDNA was produced for some of the primer sets and with various qualities. More adjustments are warrant, but it was a good first approach.
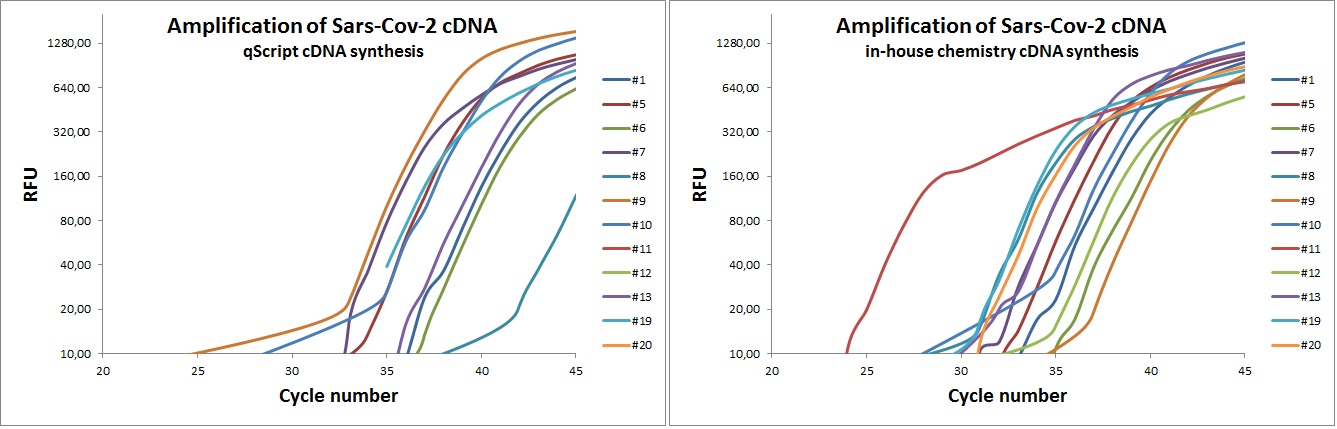
qScript vs. in-house chemistry
cDNA template was created by in-house recipe and commercial cDNA synthesis kit (qScript). The template was amplified by 12 different Sara-Cov-2 primer sets. The graphs below indicate that in-house chemistry is equal or better than qScript.
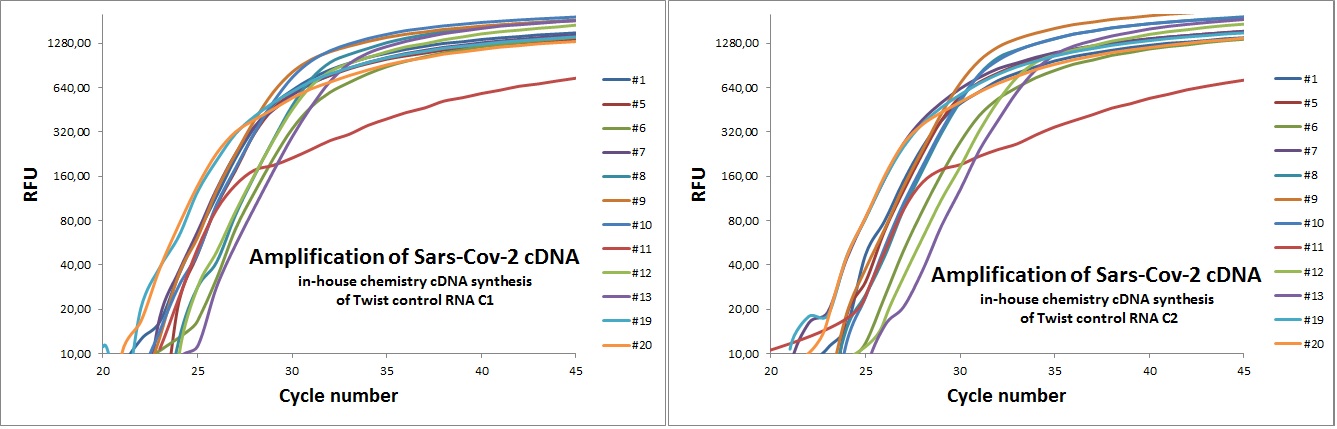
In-house chemistry used on synthetic controls
Graphs below present data on amplification of cDNA template created with in-house chemistry. Starting material was synthetic Sars-Cov-2 sequences from Twist Synthetic.
One tube reactions
The previous data was all conducted as “two tube” reaction, cDNA synthesis and real-time PCR in different steps. And with commercial “Syber Green” mix in the real-time analysis. To efficiently analyze virus RNA, the two steps need to be combined. Additionally using a TaqMAN probe would allow for incorporation of an internal standard. From the primer table, amplicons with TaqMAN probes were selected and used to optimize one-tube chemistry. The primer sets selected was #1, #5, #6, #7, #19, #20 and #21.
| Recipe | Cycling program |
 |
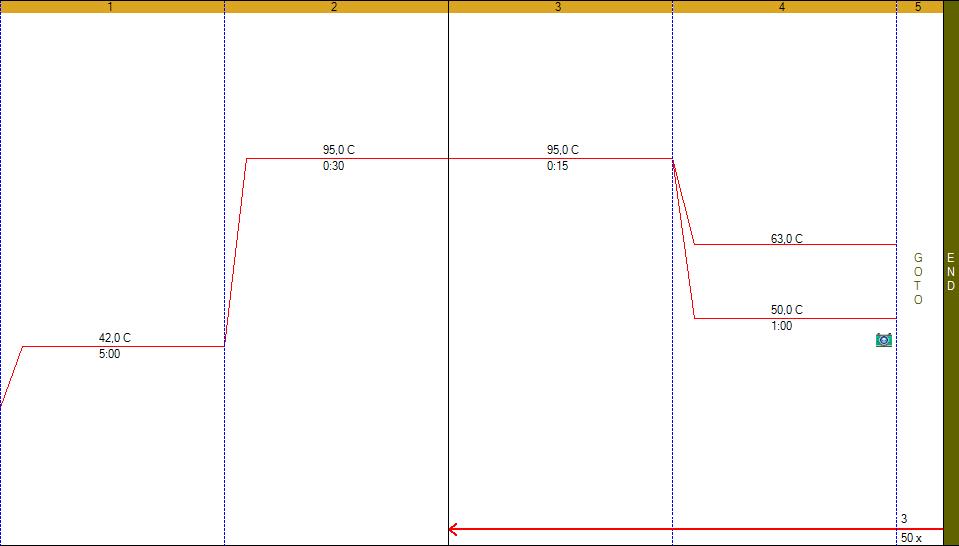 |
| A 20µl reaction volume pr. well was used with the following components. | Step #1 cDNA synthesis followed by a gradient temperature (between 50-63°C) to determine the optimal annealing temperature. |
Amplification curves for one-tube reactions on temperature gradient.
| Primer set |
First "one tube" reaction click to enlarge |
Primer set |
First "one tube" reaction click to enlarge |
| #1 | 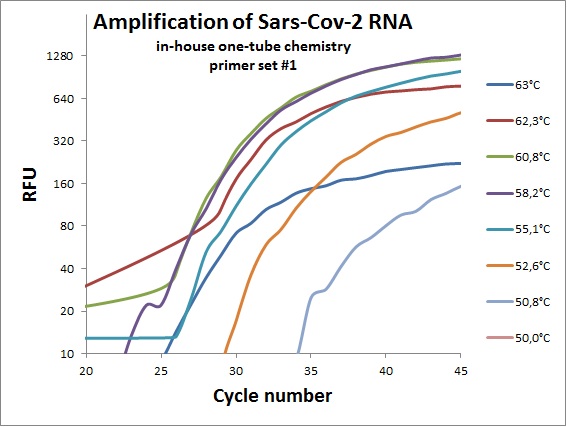 |
#19 | 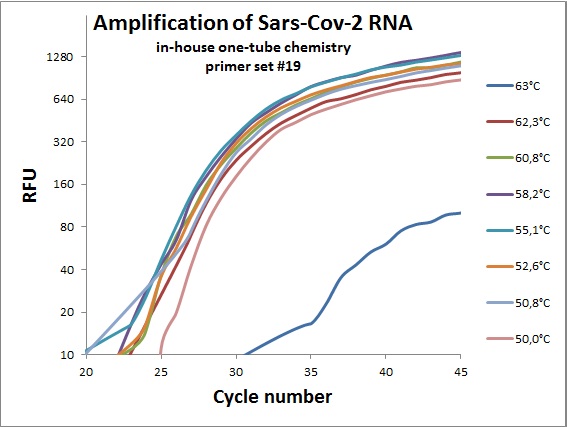 |
| #5 | 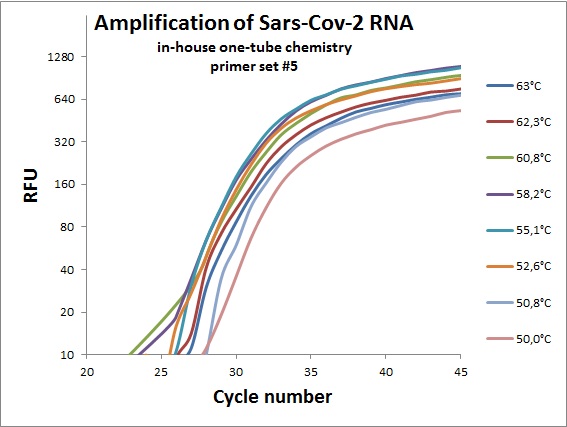 |
#20 | 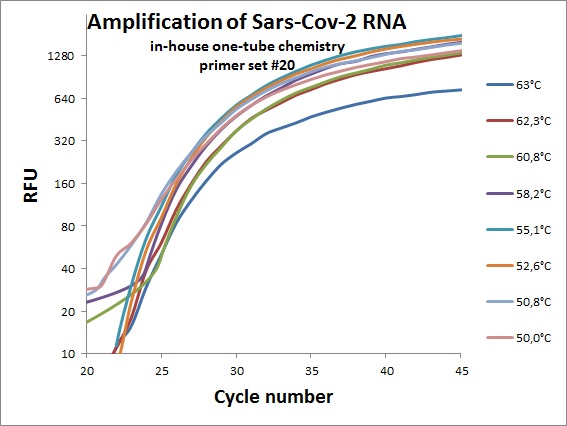 |
| #6 | 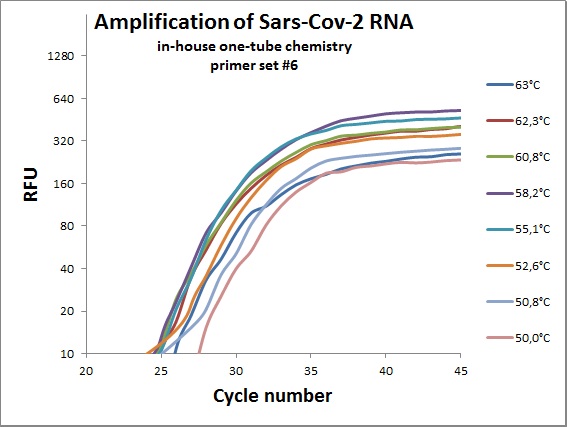 |
#21 | 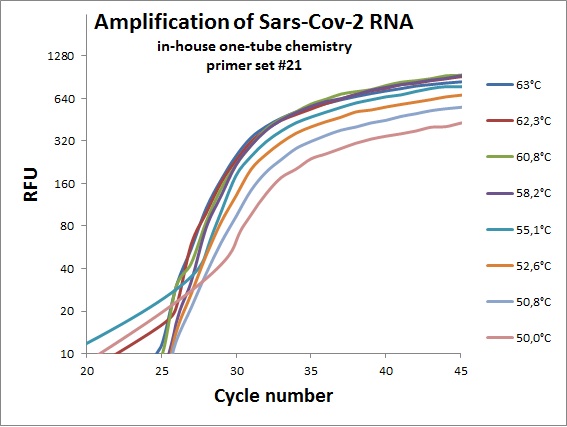 |
| #7 | 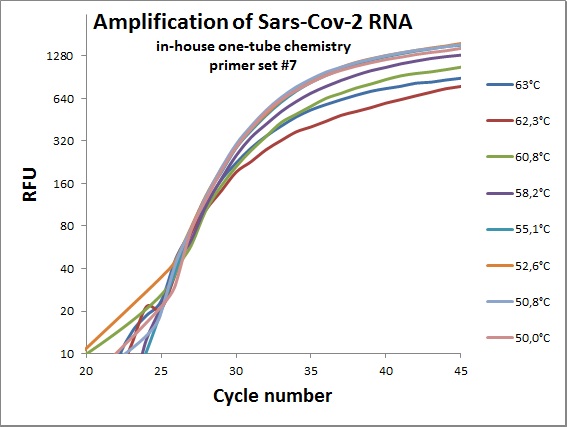 |
 One-tube dilution experiments
| Primer set |
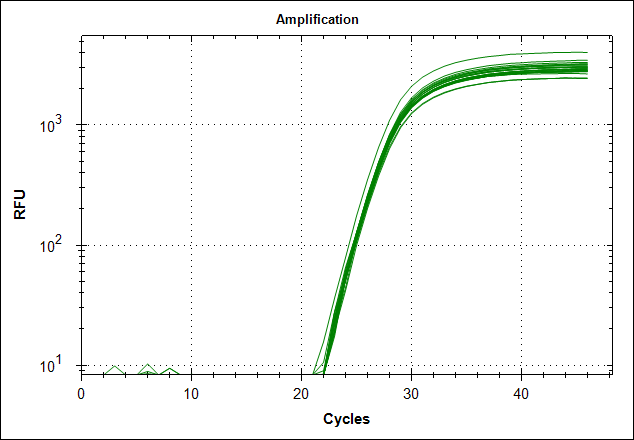
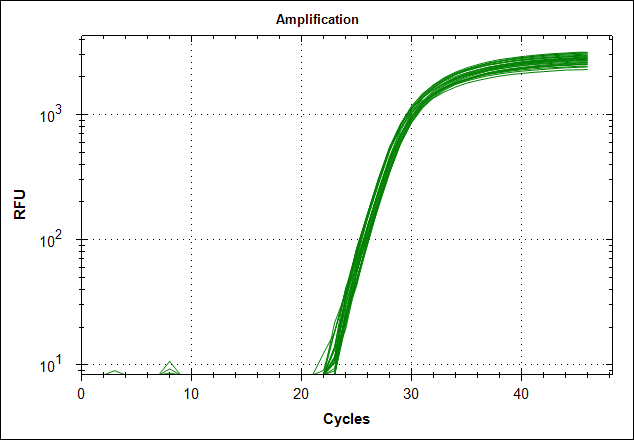
Dilution experiments, "one tube" reaction click to enlarge |
Primer set |
Dilution experiments, "one tube" reaction click to enlarge |
| #1 | 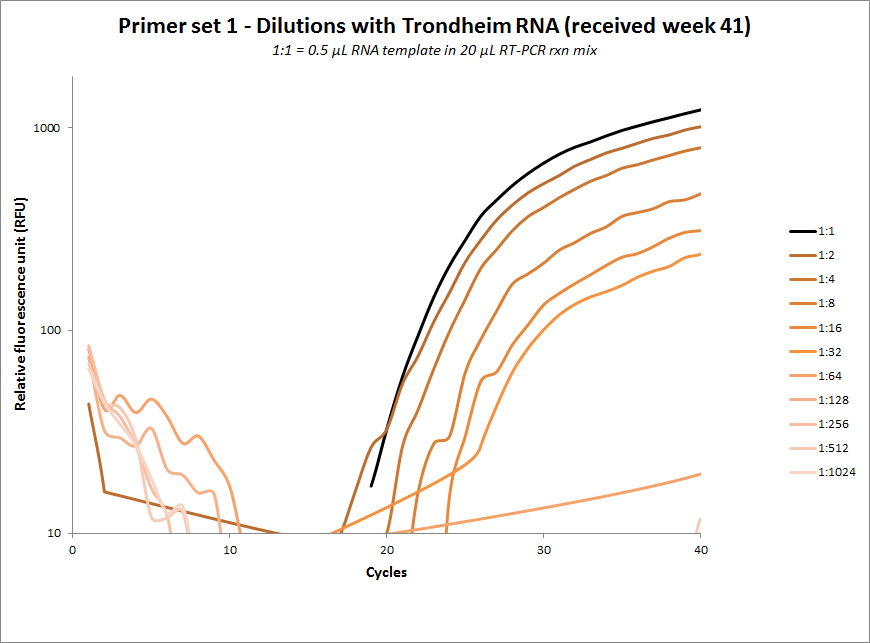 |
#19 | 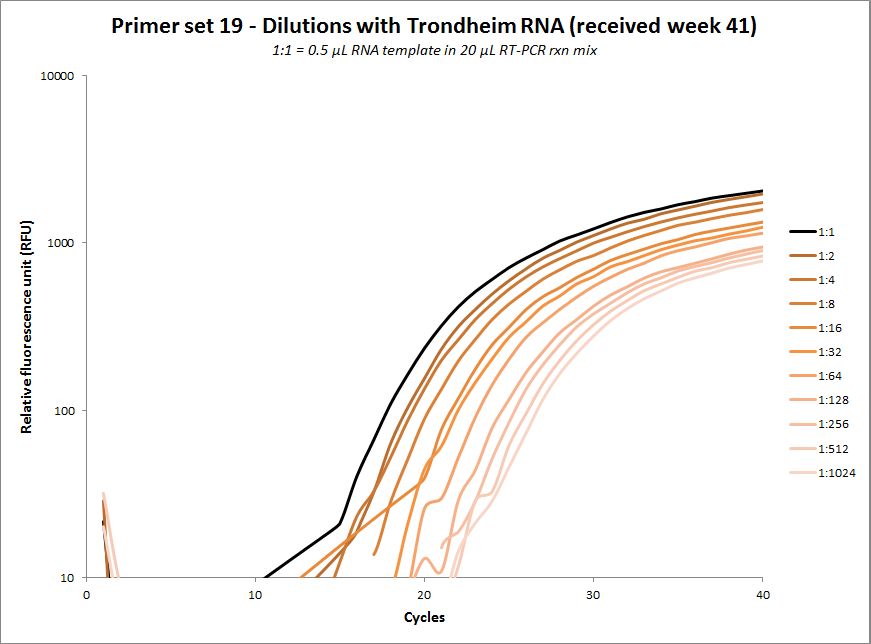 |
| #5 | 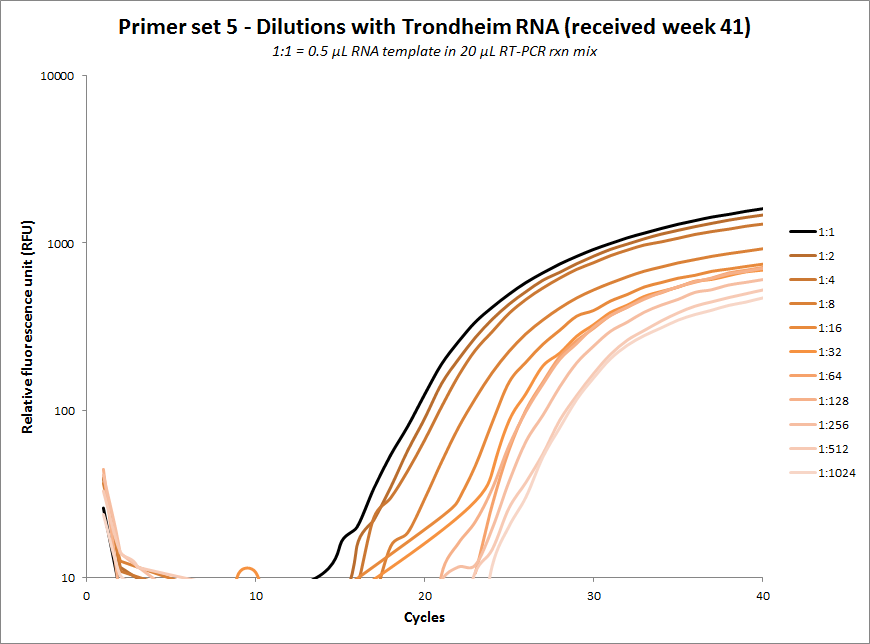 |
#20 | 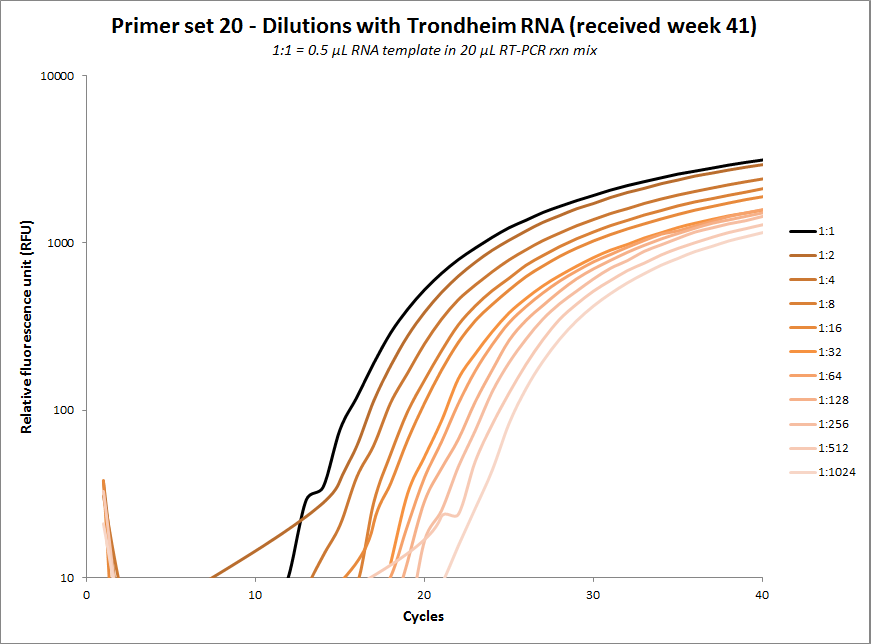 |
| #6 | 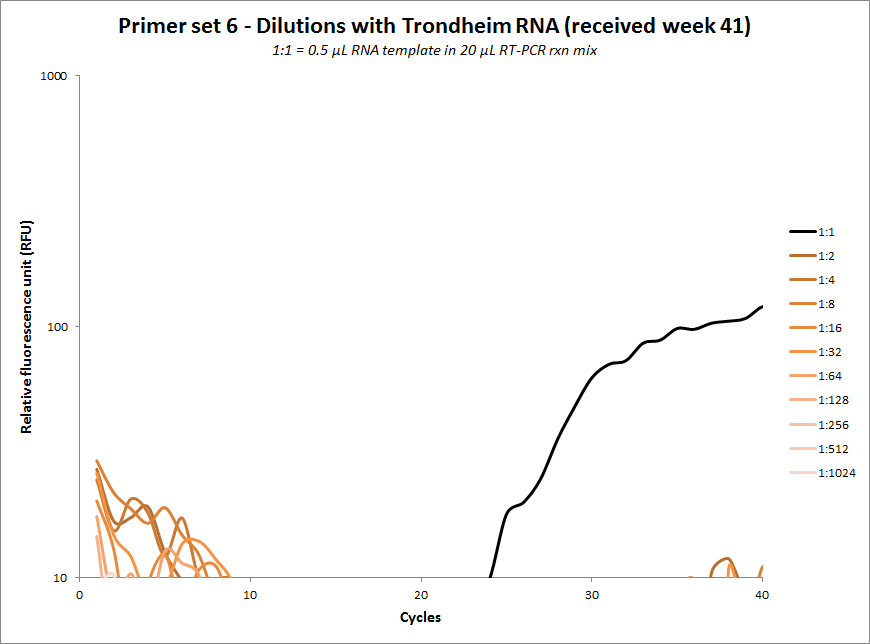 |
#21 | 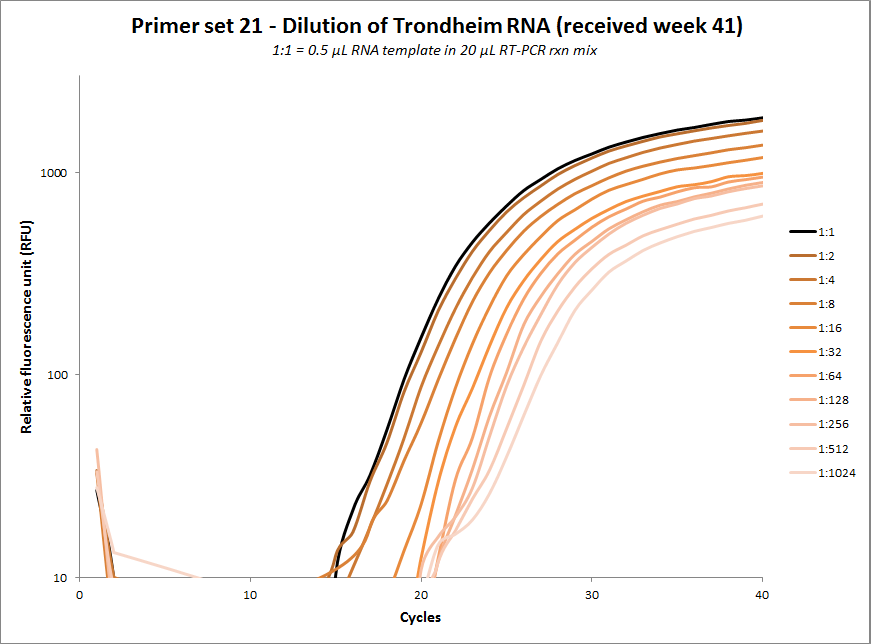 |
| #7 | 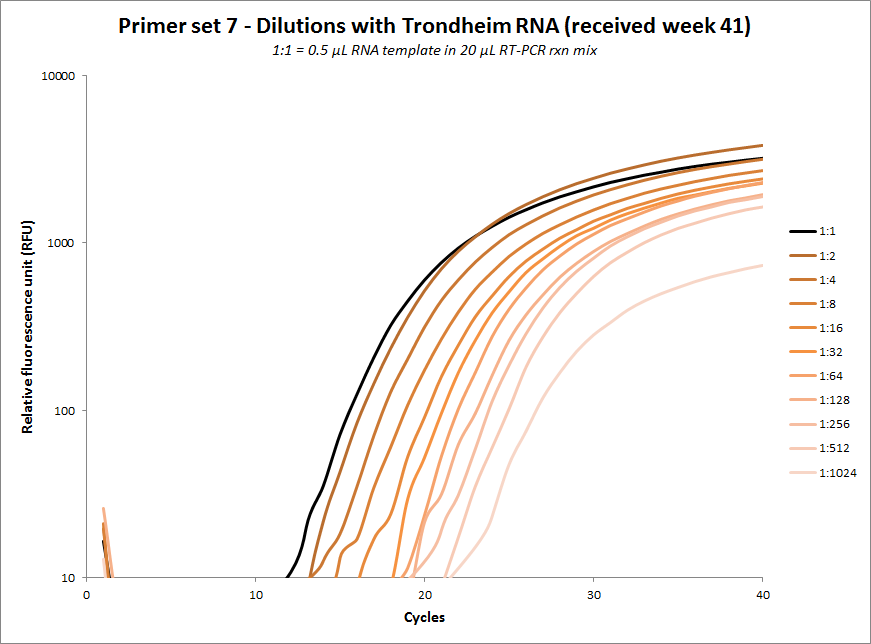 |
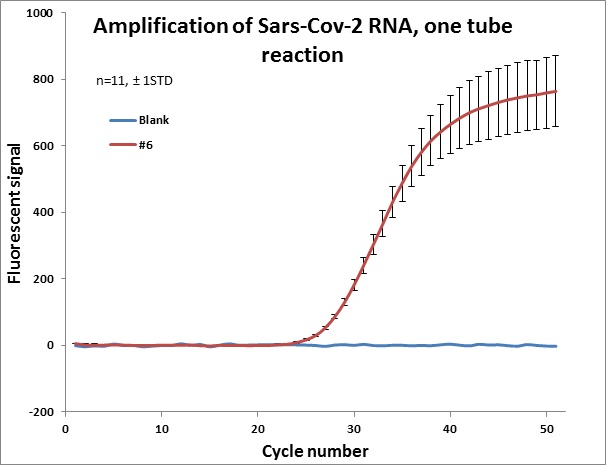
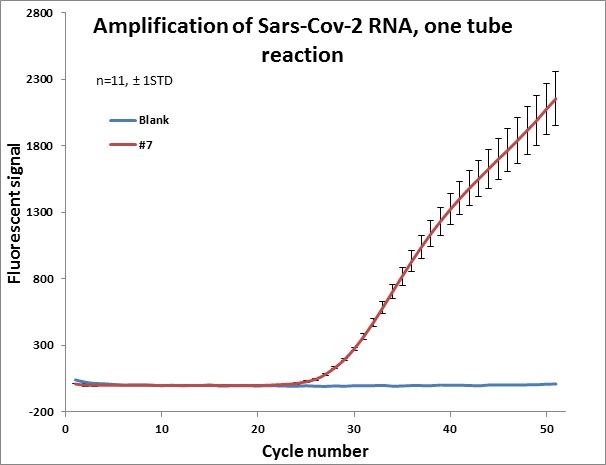
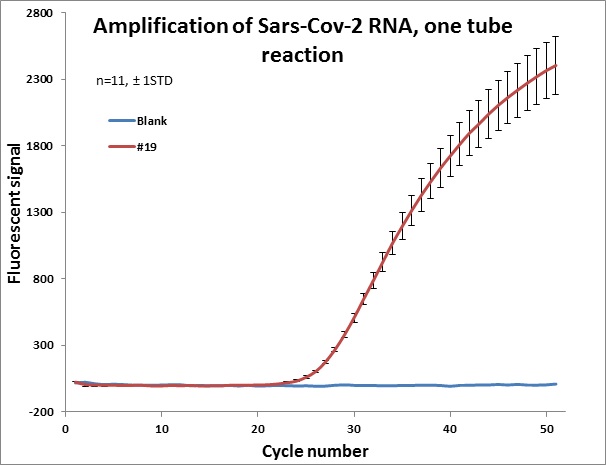
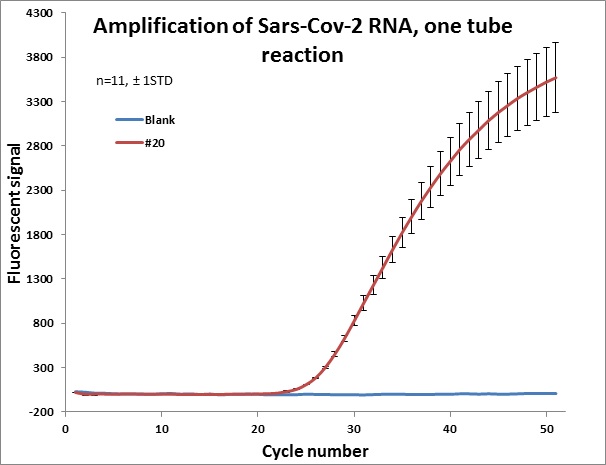
Weekly test of “one-tube” reaction for 7 different primer sets
The weekly test was done by Julia Elisabeth Simensen, more of the data can be found here.
| Week |
Weekly "one tube" test click to enlarge |
Week |
Weekly "one tube" test click to enlarge |
| 47 | 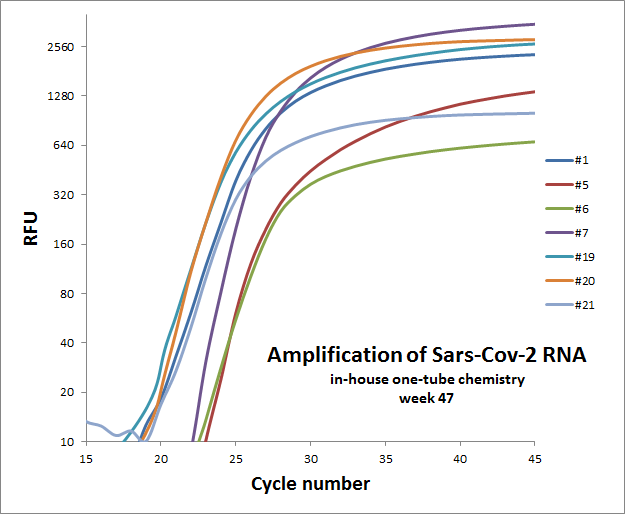 |
48 | 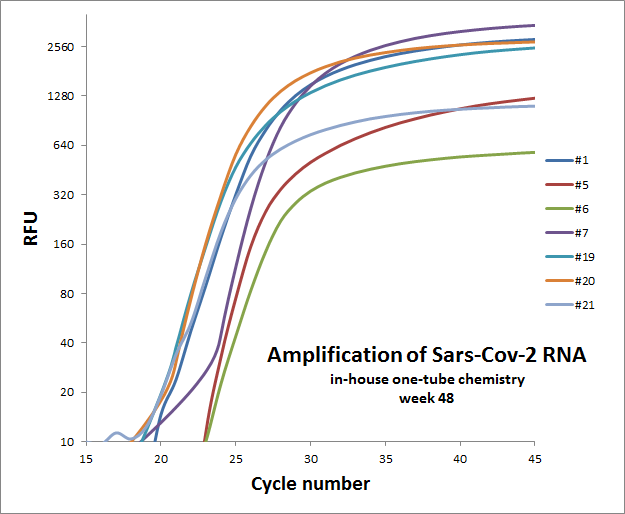 |
| 49 | 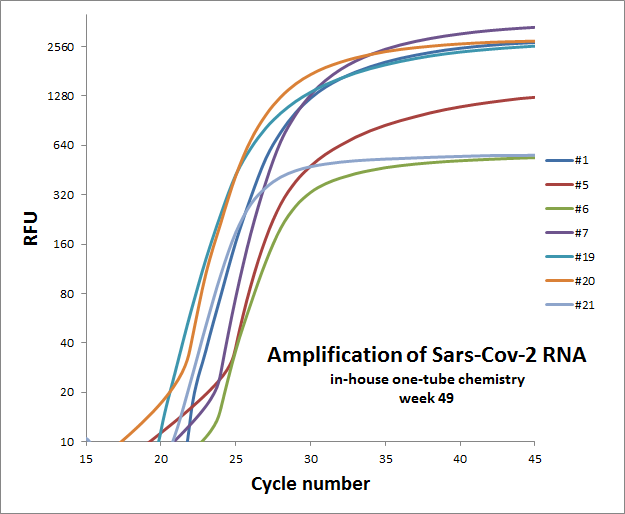 |
50 | 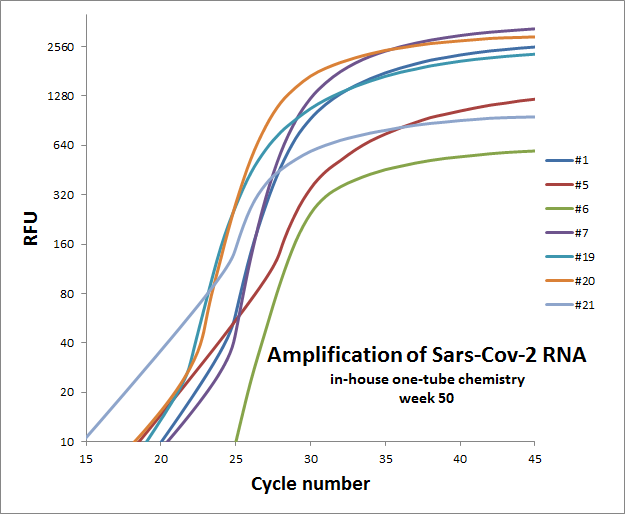 |
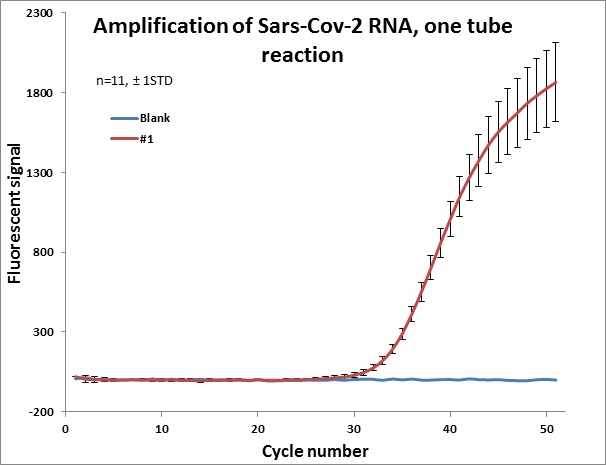
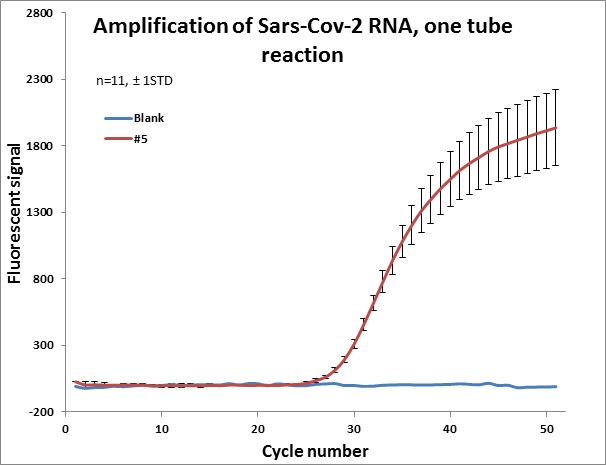
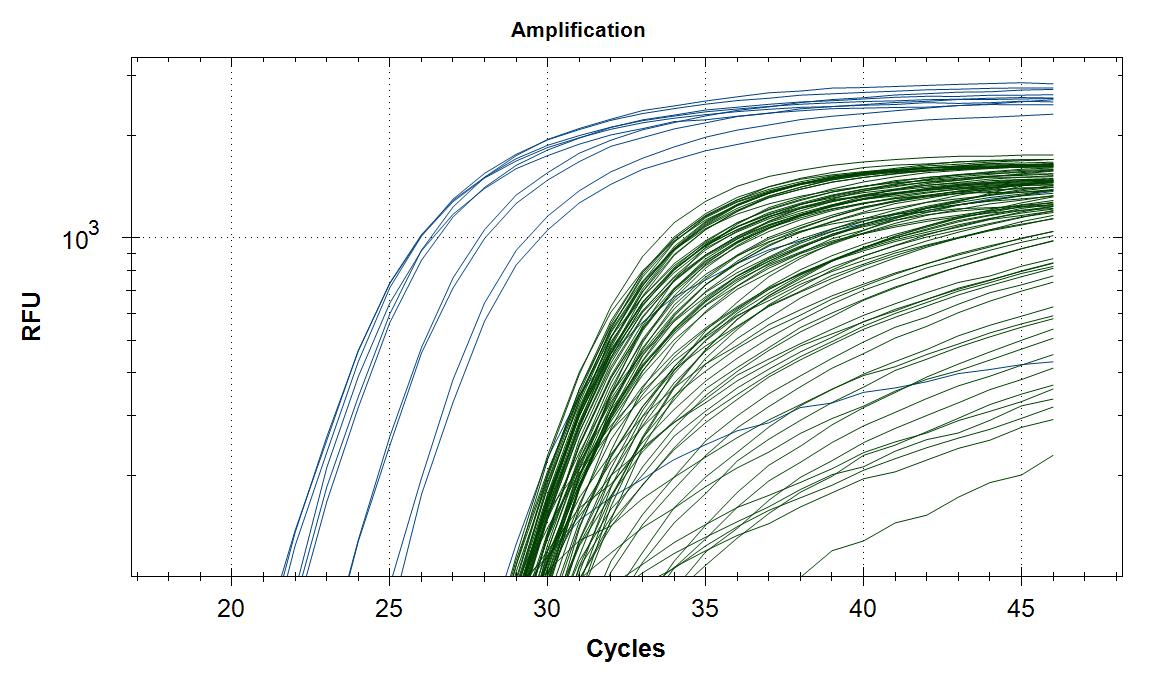
Individual results from weekly test. Amplification curve on a linear scale to show the blank (no template well).
 |
 |
 |
 |
 |
 |
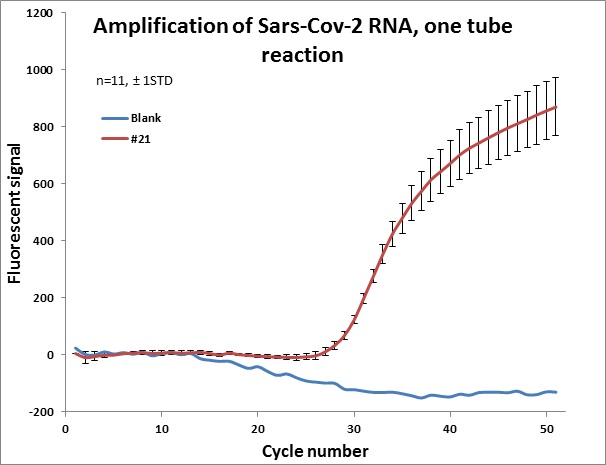 |
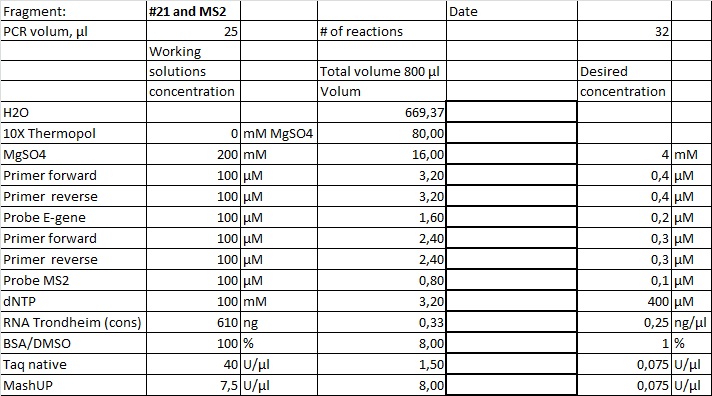
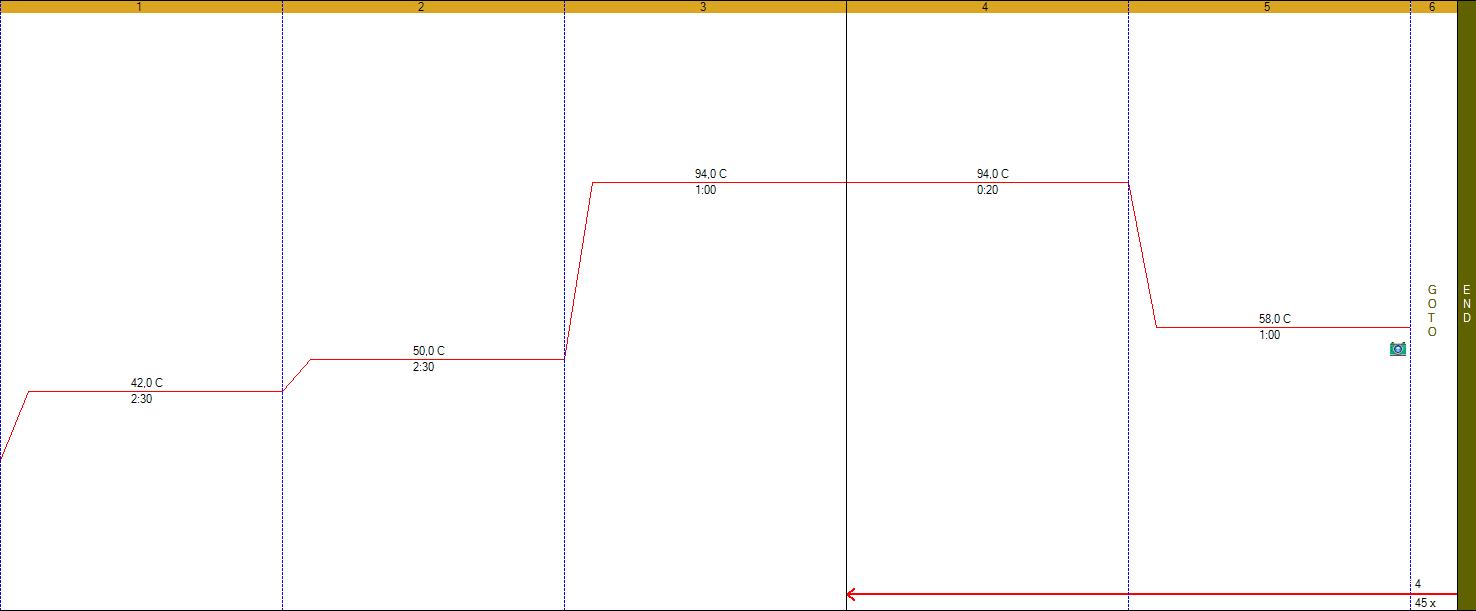
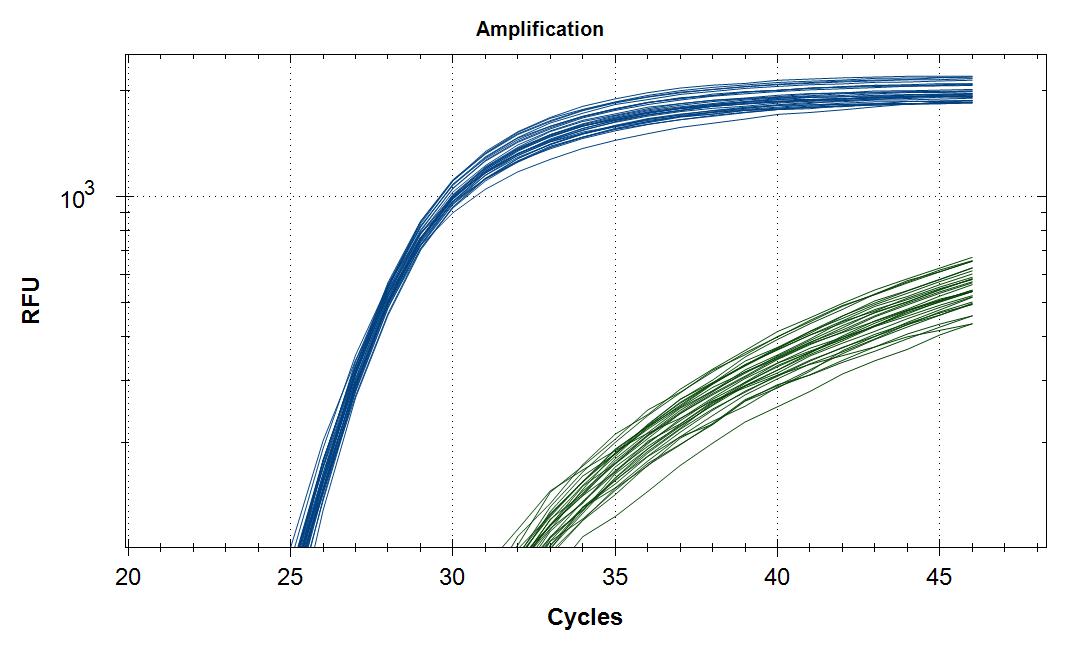
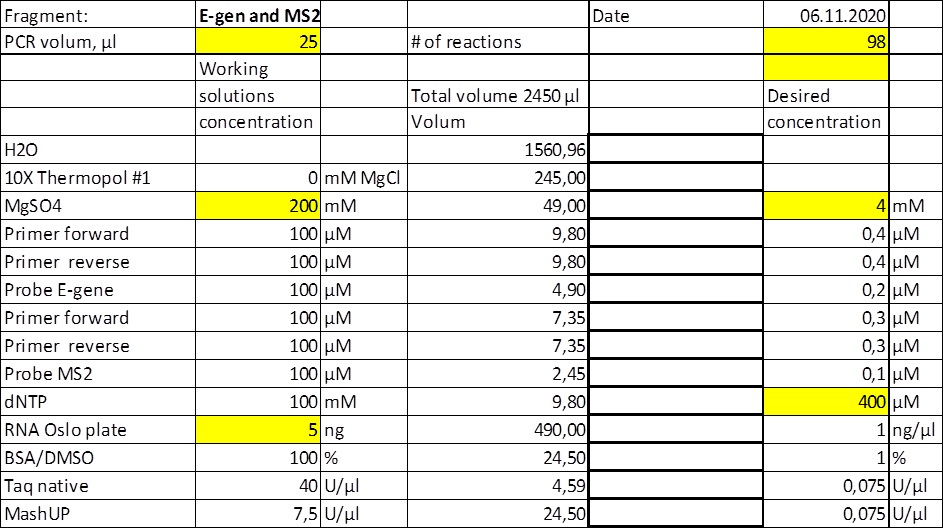
Setup with internal standard
Results, Sars-Cov-2 (blue), Internal control (green)
|
Sars-Cov-2 |
#21 |
Mean Cq |
24,8 |
1 STD |
0,2 |
|
Internal control |
MS2 |
Mean Cq |
29,0 |
1 STD |
0,7 |
| Recipe | Cycling program | Amplification |
 |
 |
 |
Test on clinical samples
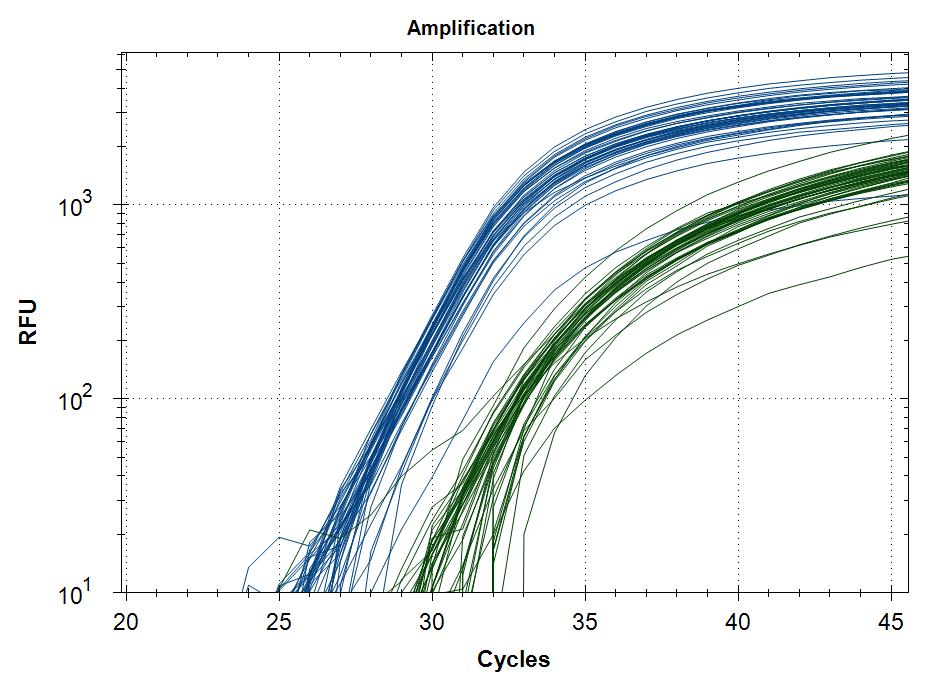
We received extracted RNA from the routine Sars-Cov-2 testing lab at Rikshospitalet/OUS. The samples were analyzed as duplicates with primer #21 (blue amplification curve) and a HEX labeled internal standard (green amplification curve). Five microliter of template (RNA) was placed in each well, blank received 5µl H2O. This was followed by 20µl of master mix. Please note that the template volume was used in the master mix calculation, but was not added in the mix but in each well individually.
| Recipe | Cycling program | Amplification all | Amplification few |
 |
|
 |
 |
Sars-Cov-2 sensitivity test
Start material, RNA extract from Trondheim. First, a large batch (1000µl) of cDNA was created and used as template in all the reaction (to omit variation due to cDNA synthesis). Thus, the tests are designed to test the efficiency of the primer stes. The cDNA mix was made of the following components; 2µl RNA, 200µl qScript mix (5x) (contains buffer and dNTP), 1µl reverse primer E gene (#21), 1µl reverse primer N gene (# 7), 786µl H2O and 10µl MashUp (reverse transcriptase). The solution was incubated at 50°C for 60 minutes.
Three 96 well plates were used in the dilution series;
Plate # 1, 10µl cDNA plus 100µl qPCR MIX and serial diluted by a factor of 2
Plate # 2, 1µl cDNA plus 100µl qPCR MIX and serial diluted by a factor of 2
Plate # 3, 1µl cDNA plus 100µl qPCR MIX and serial diluted by a factor of 3
|
Plate#1 |
|
|
|
|
|
|
|
|
|
|
|
|
1/1 |
1/2 |
1/4 |
1/8 |
1/16 |
1/32 |
1/64 |
1/128 |
1/256 |
1/512 |
1/1024 |
1/2048 |
|
Plate#2 |
|
|
|
|
|
|
|
|
|
|
|
|
1/10 |
1/20 |
1/40 |
1/80 |
1/160 |
1/320 |
1/640 |
1/1280 |
1/2560 |
1/5120 |
1/10240 |
1/20480 |
|
Plate#3 |
|
|
|
|
|
|
|
|
|
|
|
|
1/10 |
1/30 |
1/90 |
1/270 |
1/810 |
1/2430 |
1/7290 |
1/21870 |
1/65610 |
1/196830 |
1/590490 |
1/1771470 |
Recipe for the qPCR mix, each well revived a total of 10 µl mix
PCR temp cycling program: Initial boiling, 94°C-1min, 45 cycles of 94°C-20sec, annealing 56°C-20sec, extension 72°C-40sec (picture), after the final cycle melting analysis was performed.
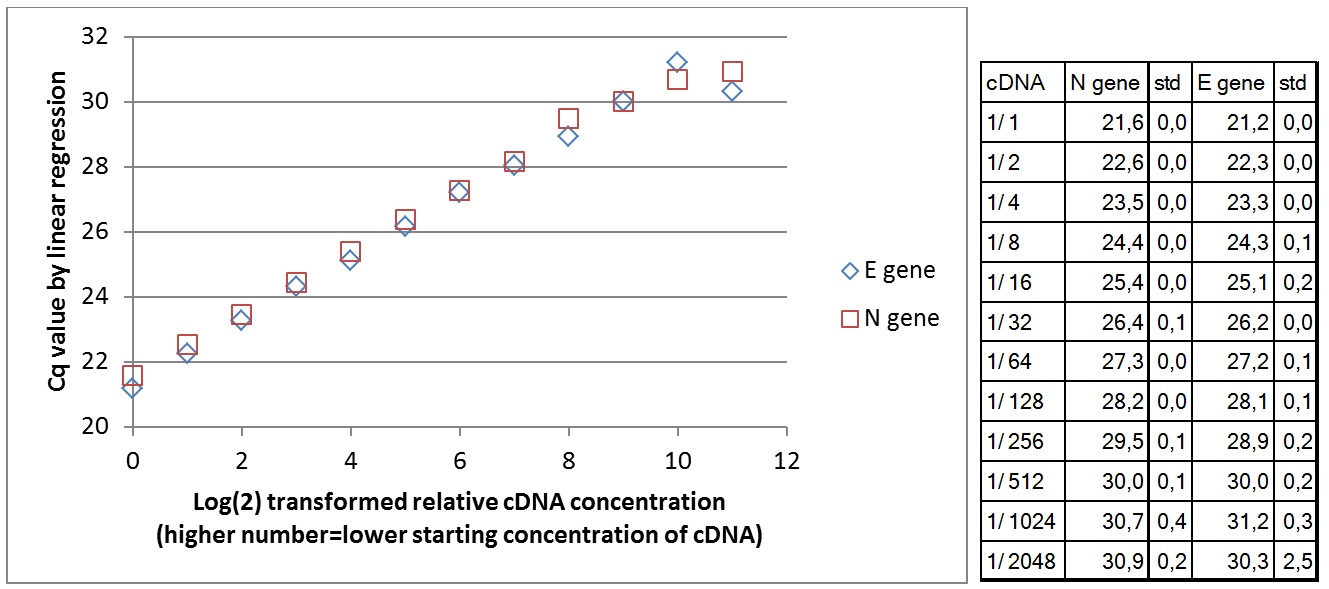
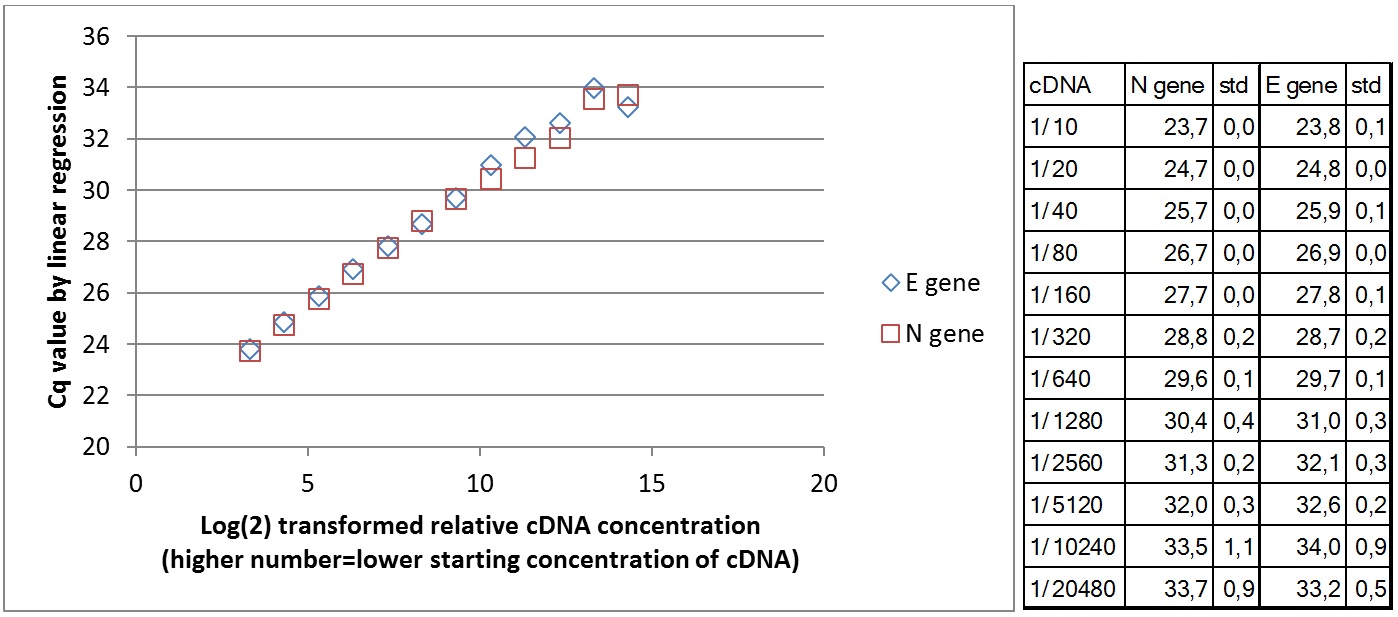
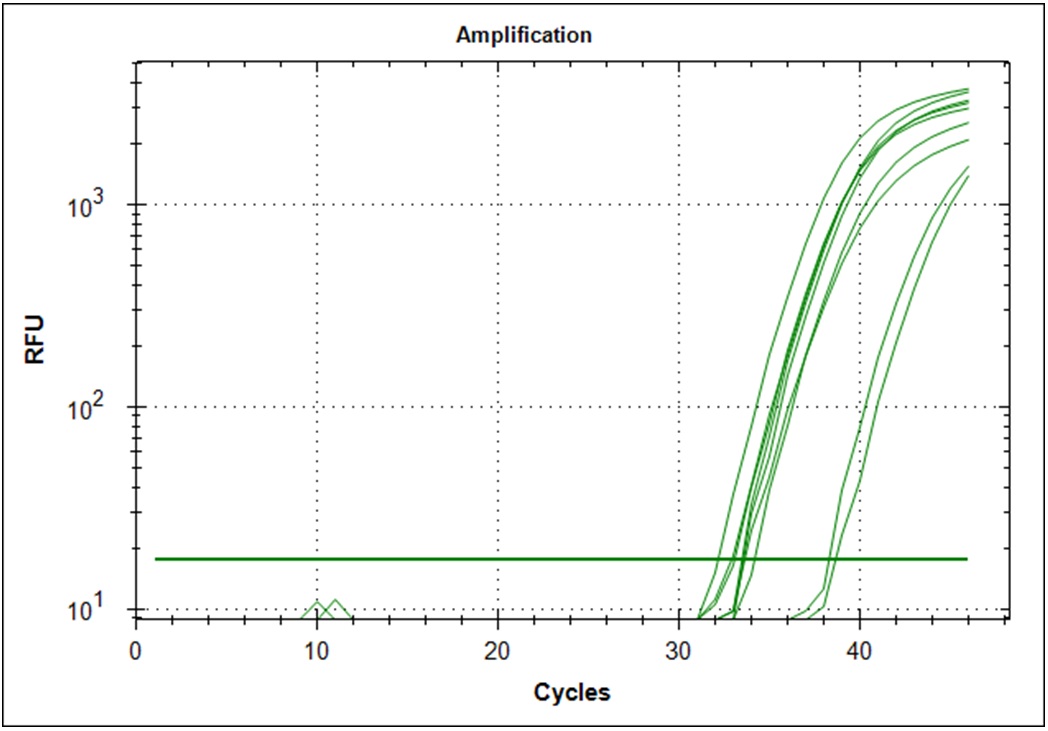
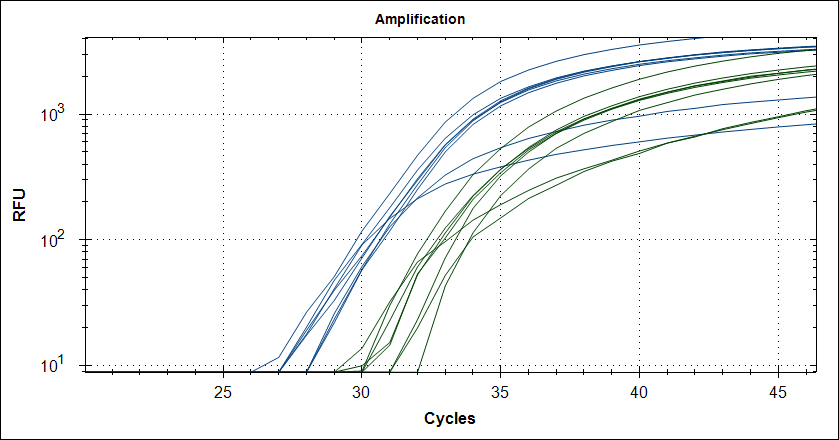
Amplification curves for 12 different cDNA concentrations (click to enlarge).
| Plate #1 |  |
 |
| Plate #2 | 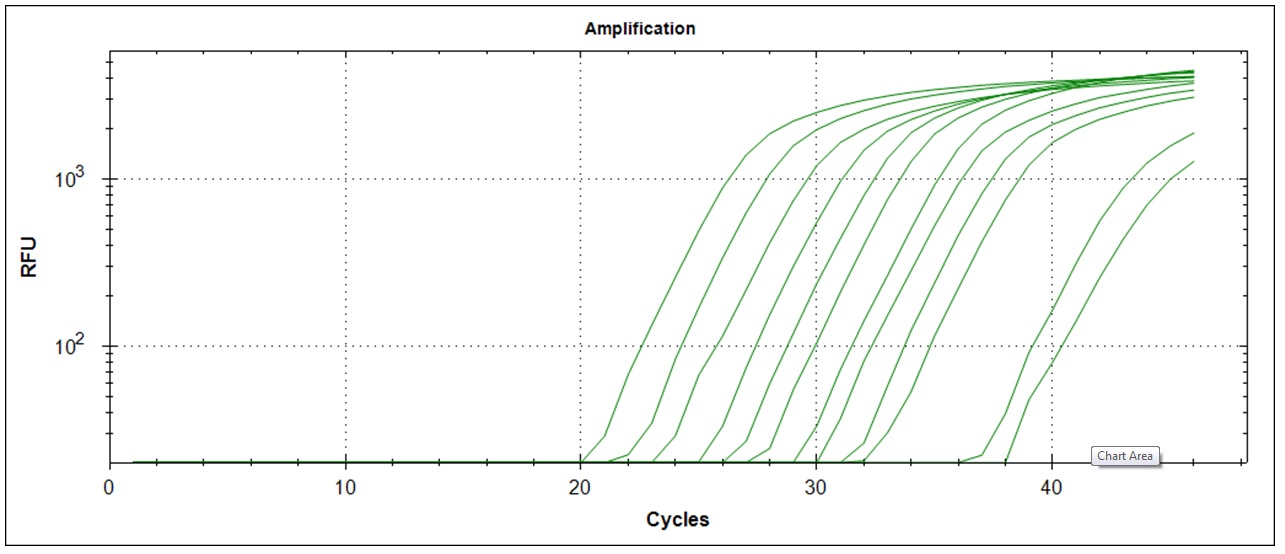 |
 |
| Plate #3 | 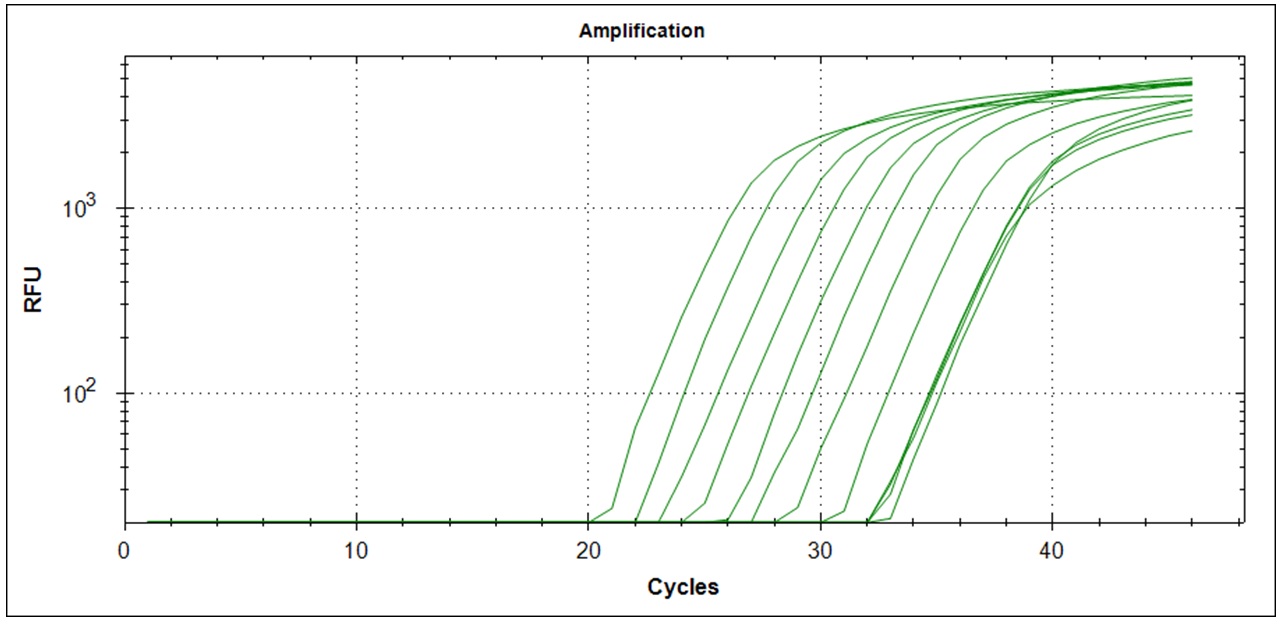 |
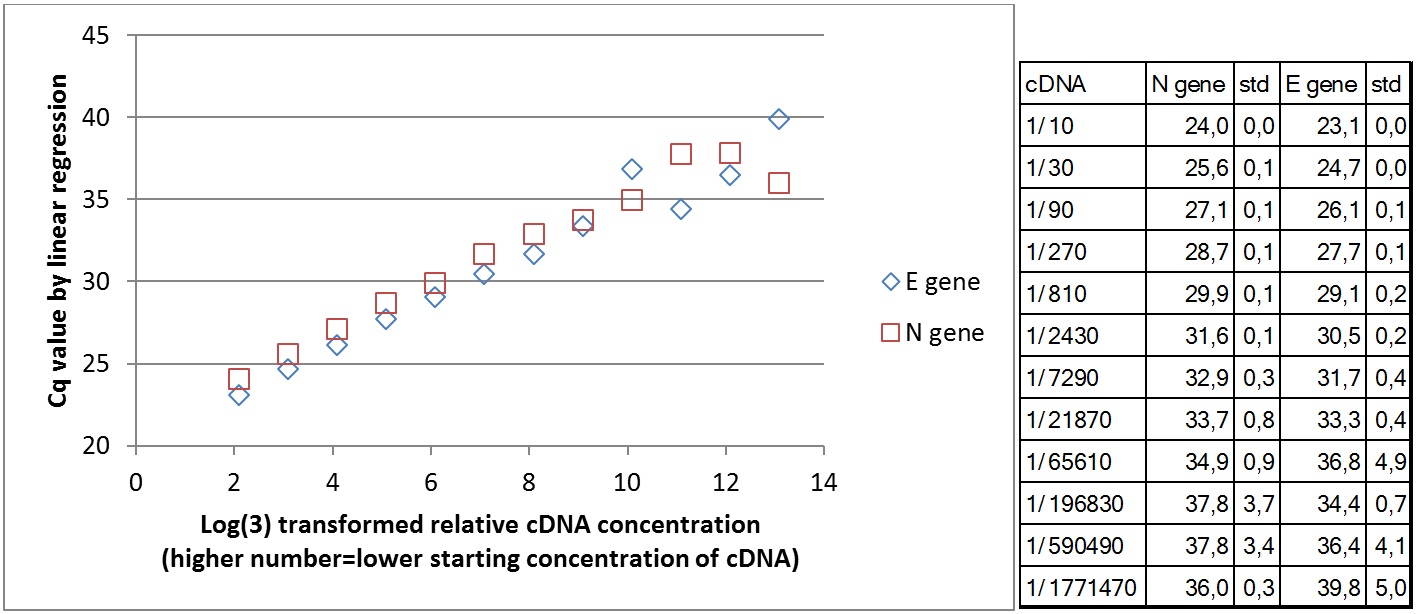 |
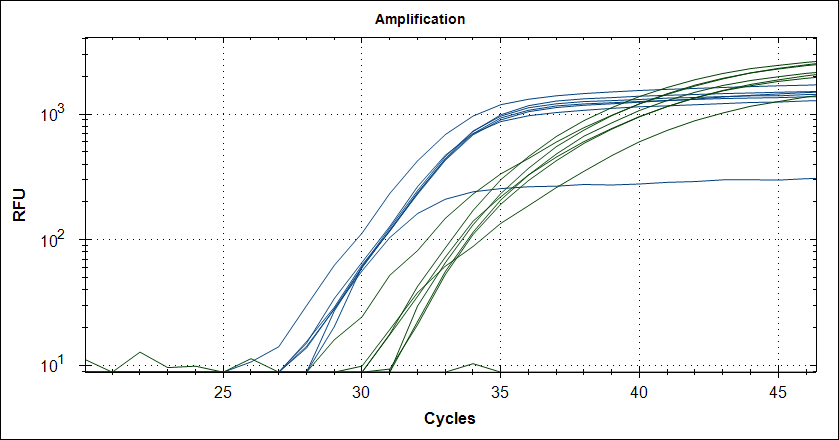
Wells with higher cDNA contraction give signal first. Below is the comparison of mean Cq value for 3 replicates in relation to cDNA concentration for the two primer sets teste. At lower cDNA concentration, the Cq value increases. Due to stochastic variation in the PCR reaction, it is not possible to quantify the number of starting molecules using qPCR. The signal generated depends on the PCR efficiency and number of copies amplified in the first few cycles. The data show that the PCR efficiency changes at low concentrations of cDNA. The theoretical lower template amount (pr. µl) that gave a signal was 1/(9*109) of the original RNA in the Trondheim sample. This is under the assumption that all RNA copies were converted to amplifiable cDNA in reverse transcriptase synthesis.
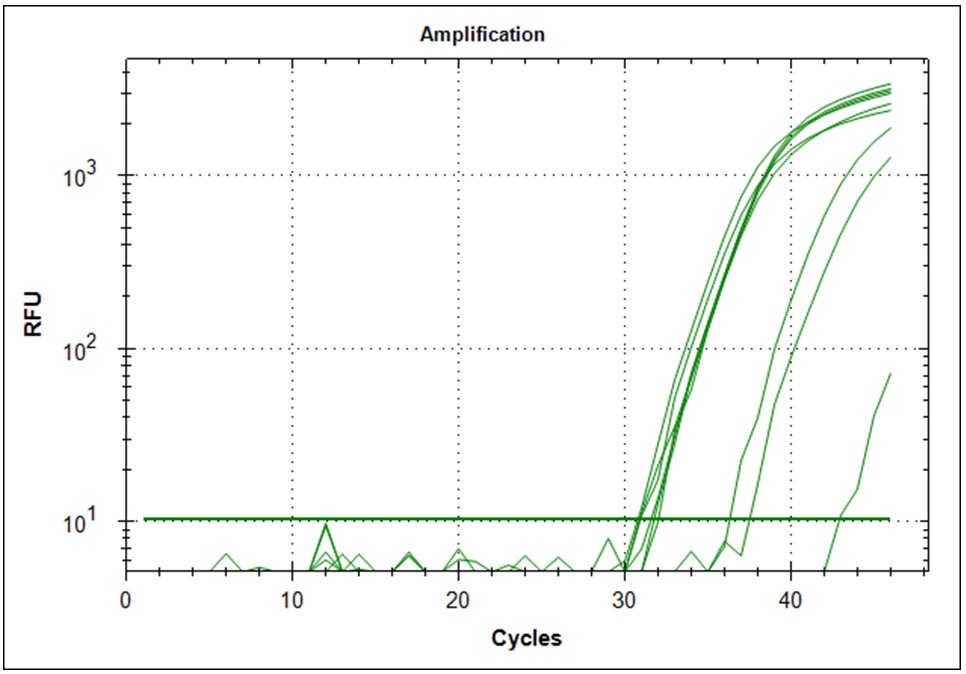
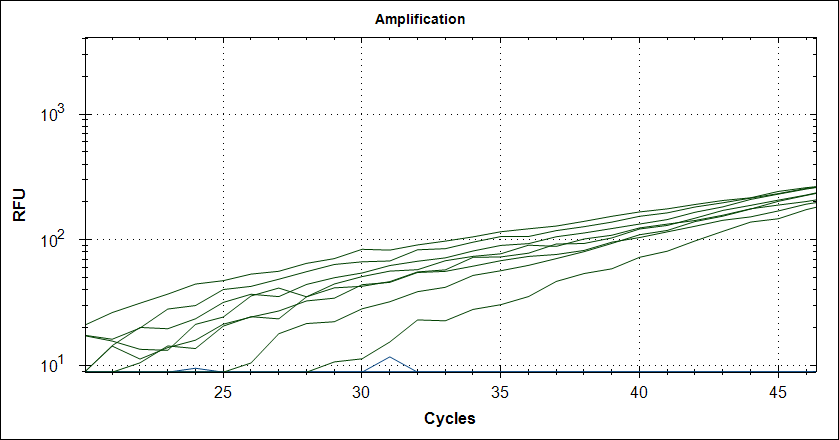
Amplification curves for the 3 lowest cDNA concentrations with 3 replicates each for the two primer sets used.
| N-gene, #7 | E-gene, #21 |
 |
 |
Limiting dilution
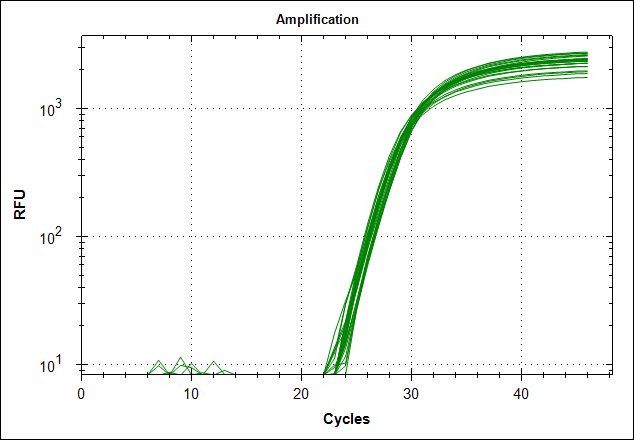
Start material, 2µl RNA from the original Trondheim in a 1000µl cDNA synthesis reaction. 1µl of this solution is diluted in 200µl H20, 1µl of this dilution is diluted in 200µl H20. From the last dilution, 10µl was used as template in a 500µl qPCR mix. The dilution from the original RNA then becomes. 1/500 * 1/200 * 1/200 * 10/500 which becomes 1/(1*109) per µl. Since there is 10µl qPCR mix per well, we start with 1/(1*108) of the starting material. Simultaneously a 1/(5*109) was made. Primer set #21 was used for the amplification.
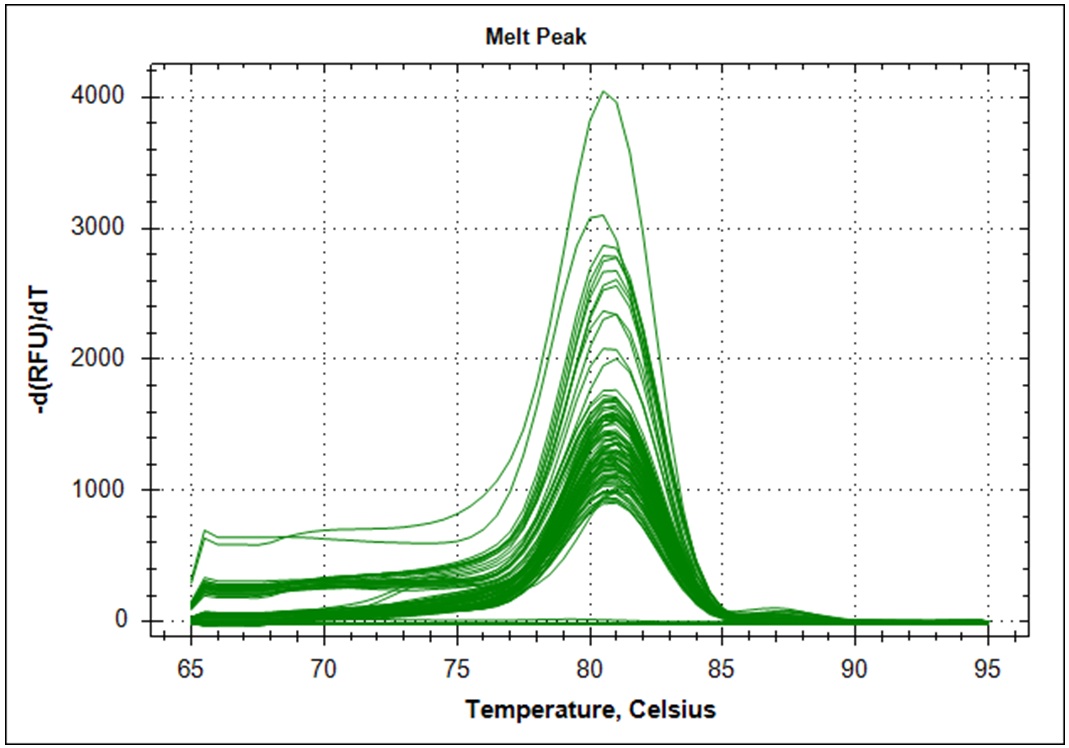
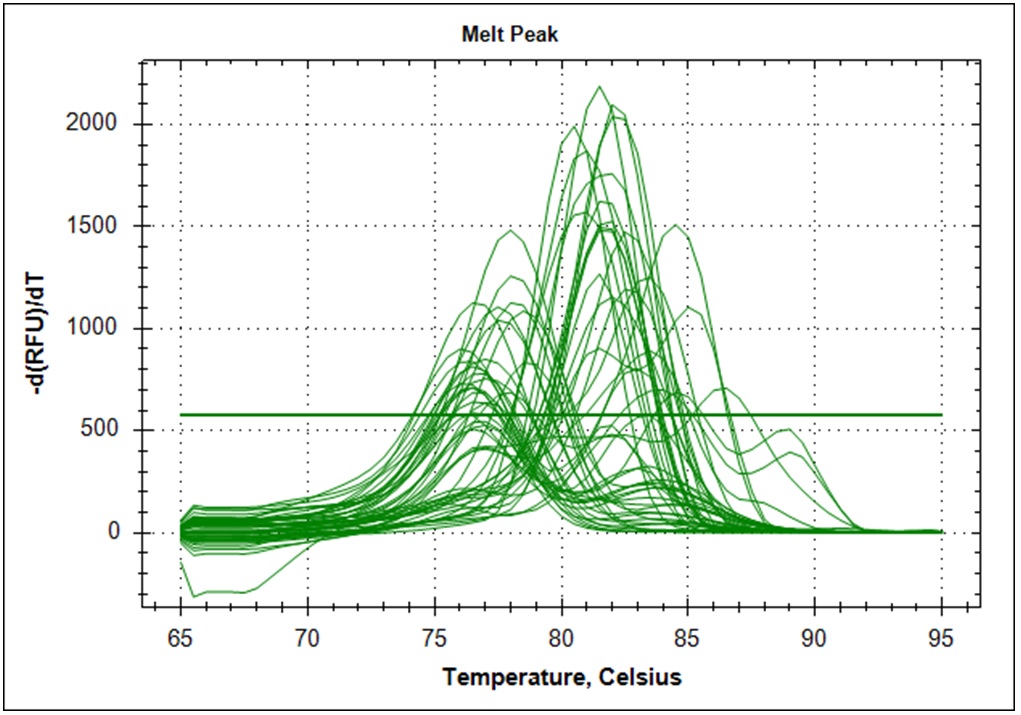
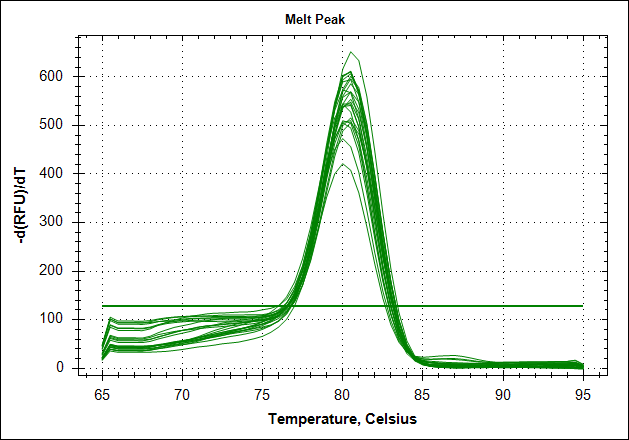
Target amplification was determined by melting curve analysis. Correct amplified DNA will go from double strand DNA to single strand DNA at a very temperature specific manner. Thus, unspecific amplification product will melt at different temperatures. This will give a different signal in the DNA melting point analysis. Below is the melting point analysis for the fragment amplified with primer set #21. The example shows the derivative melting curves when enough templates have been added. The average melting temperature is 80.8°C (STD 1.3). In the analysis with low template samples, peaks with a melting temperature between 81°C to 82°C were considered to be "true" amplification product.
| Dilution factor | 1*108 | 5*109 |
| Amplification curves (n=48) | 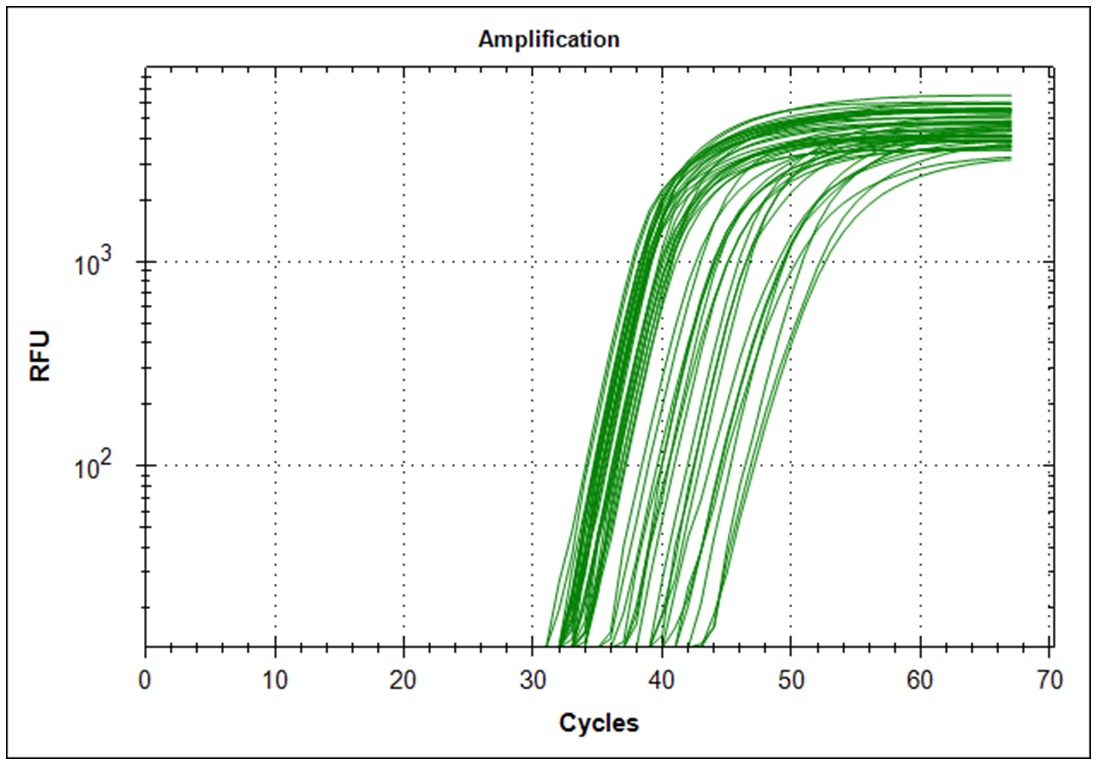 |
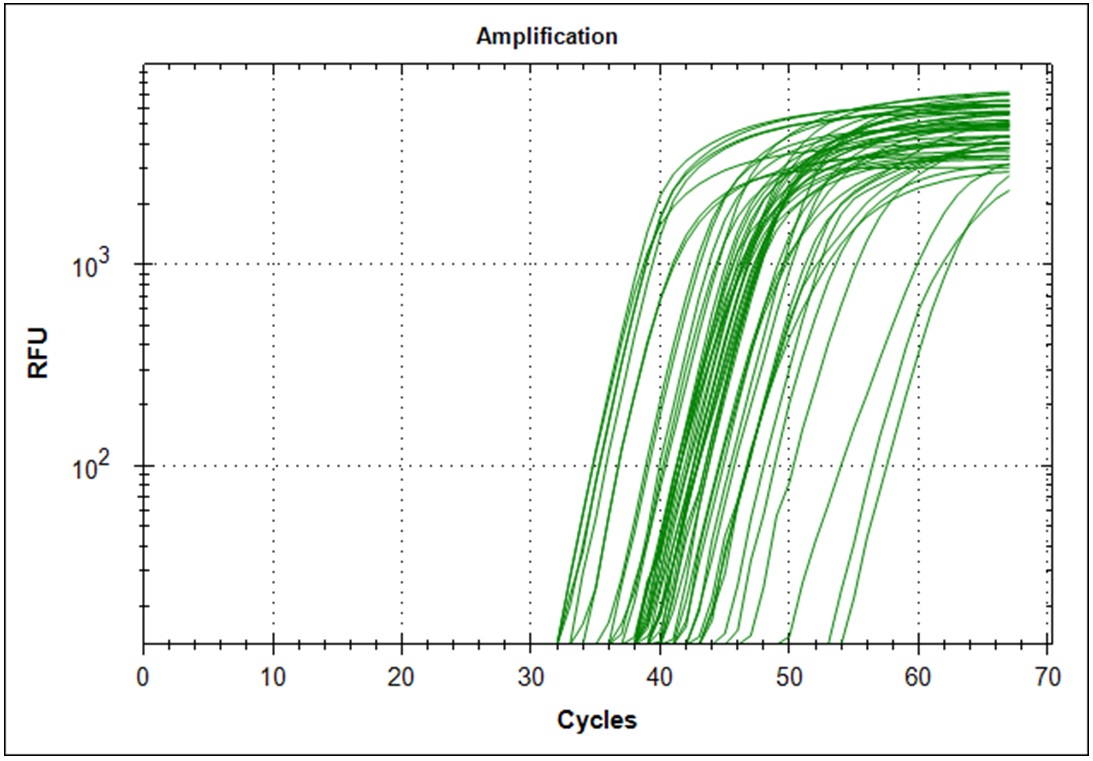 |
| Derivative of the melting curves (n=48) | 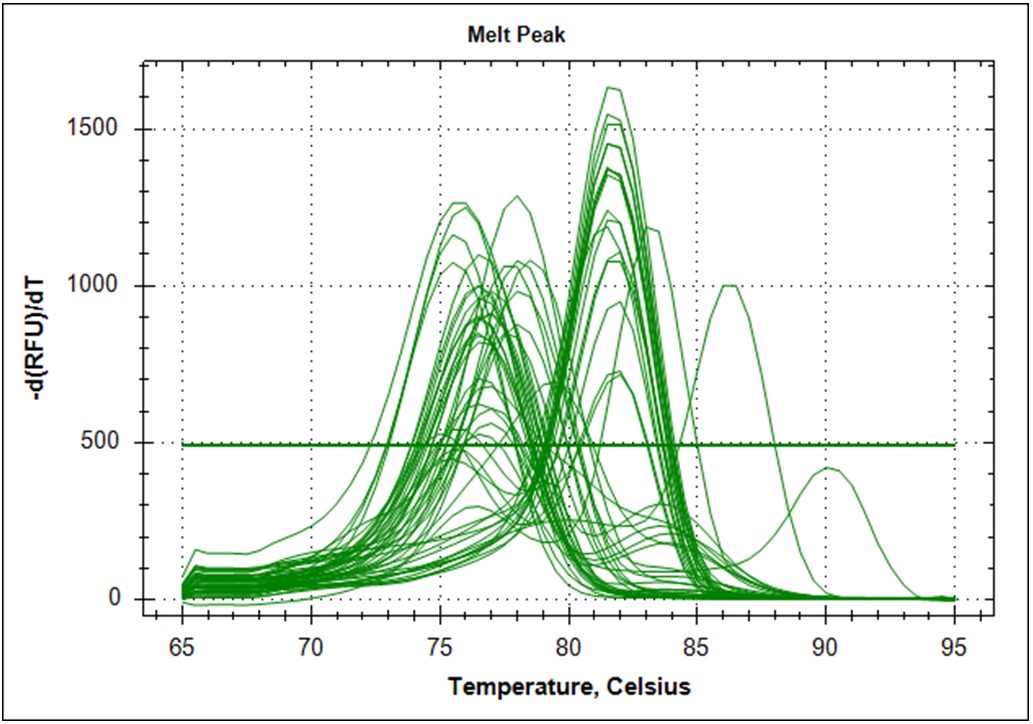 |
 |
The data from the limiting dilution experiment are summarized in the table below
|
Dilution factor, 1*108 |
||||||
|
Cq |
STD |
Melt |
STD |
n |
% |
|
|
41,7 |
3,9 |
77,4 |
2,2 |
31 |
65 % |
Unspecific fragment |
|
36,2 |
0,8 |
81,6 |
0,2 |
17 |
35 % |
Target fragment |
|
Dilution factor, 5*109 |
||||||
|
Cq |
STD |
Melt |
STD |
n |
% |
|
|
45,3 |
5,0 |
79,3 |
3,3 |
36 |
75 % |
Unspecific fragment |
|
42,3 |
5,0 |
81,6 |
0,4 |
12 |
25 % |
Target fragment |
Creating “hot start” TAQ, and test thereof
Use of Taq polymerase specific monoclonal antibodies (Mab) to inhibit enzymatic activity (before initial denaturation in the PCR) is a well-documented method. Antibodies was expressed in hybridomas and purified by David J. Warren. Three different concentrations of Mab/Taq mixes were tested.
Mixes of Taq and Mab made before the setup of the PCR reaction.
|
Mab concentration |
||||
|
|
1 µg/ 5U Taq |
0.5 µg/ 5U Taq |
0.1 µg/ 5U Taq |
|
|
10xBuffer |
4 |
4 |
4 |
µl |
|
Taq 40U/µl |
1 |
1 |
1 |
µl |
|
MAb |
9 |
4,5 |
0,1 |
µl |
|
H2O |
26 |
30,5 |
34,1 |
µl |
|
|
Incubate for 10 min at room temp. |
|
||
Master Mix without Taq
19µl of the different Taq/Mab mixes where added to 250µl of the master mix above. 0.5 µl Taq (without Mab) was added to the control.
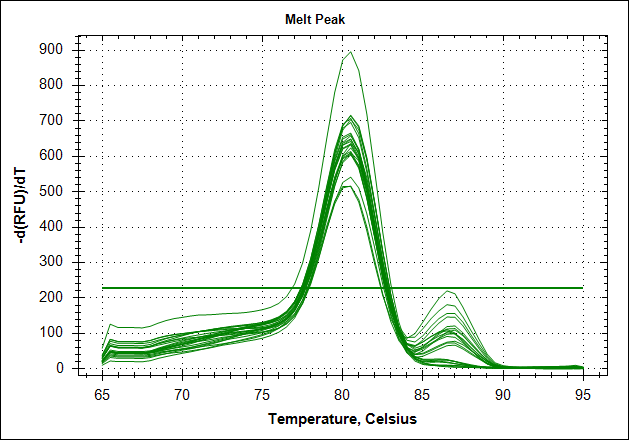
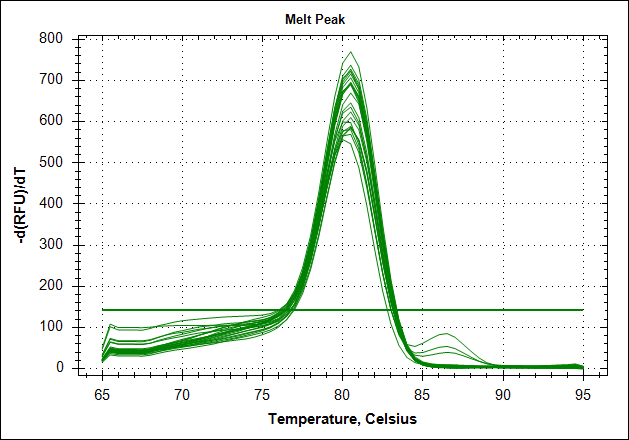
Derivative of the melting curve and the amplification curves are depicted below in the following order.
| Primer set #21 | 0 MAb | 0,1µg MAb | 0,5µg MAb | 1µg MAb |
| Amplification curves | 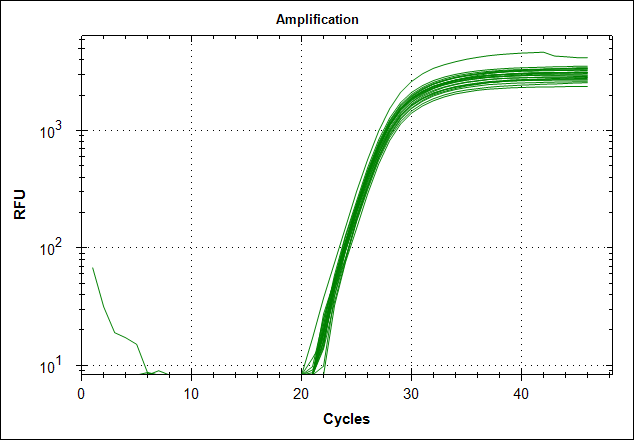 |
 |
 |
 |
| Derivative of the melting curve | 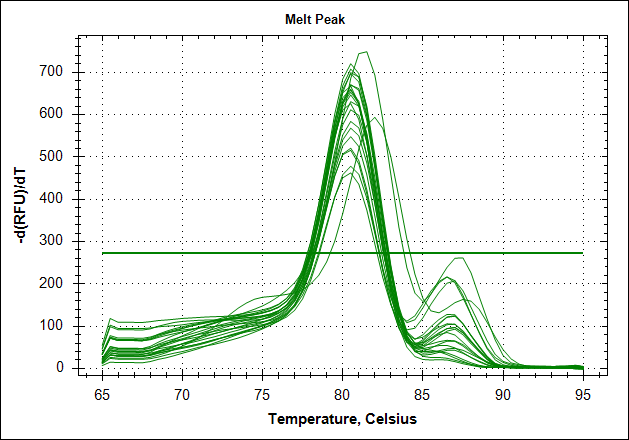 |
 |
 |
 |
| Mean Cq | 24.4 | 25.0 | 25.8 | 26.1 |
| 1 STD | 0.12 | 0.07 | 0.33 | 0.57 |
The data show that there are more impurities with reduced MAb concentration. Which also corresponds with the Cq values. The PCR was started with 2 minute incubation at 94°C. This is most likely not enough to denature all the MAb at the highest concentration which is reflected in a high Cq value (needs a few more cycles to get going). This can also increase the variation between the 24 replicates.
MAb testing with complete one tube chemistry.
Starting template, pool of RNA from Rikshospitalet (anonymous samples) spiked with Covid RNA from Trondheim. First experiment, keeping complete mix at 4°C for 2.5h The mix is split in 2, one subjected to cDNA synthesis 42°C 180 sec and 50°C 180 sec, then store at 4°C for 2.5h, the other half, straight into the fridge. After 2.5 hours, plate out and run cDNA synthesis and TaqMan probe PCR.
|
Straight into the fridge, store at 4°C for 2.5h |
cDNA synthesis 42°C 180 sec and 50°C 180 sec, then store 4°C for 2.5h |
|
|
Taq (no Mab) |
 |
 |
|
Taq with 0.5µg MAb |
 |
 |
|
Taq with 1µg MAb |
 |
 |
Reproducebility
Starting template, pool of RNA from Rikshospitalet (anonymous samples) spiked with Covid RNA from Trondheim.
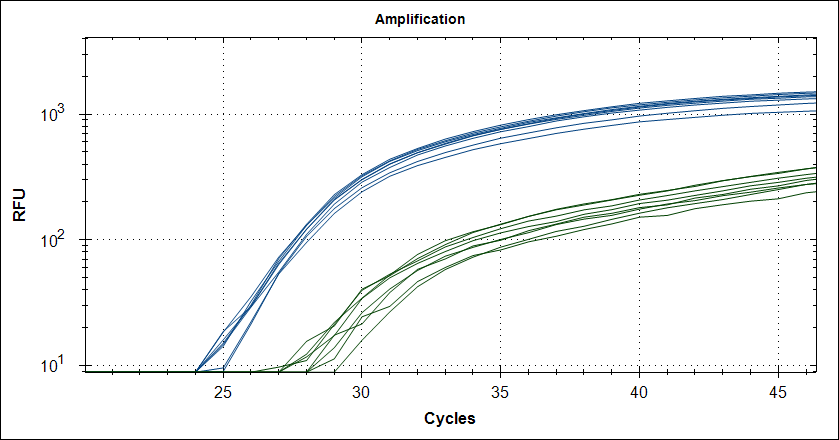
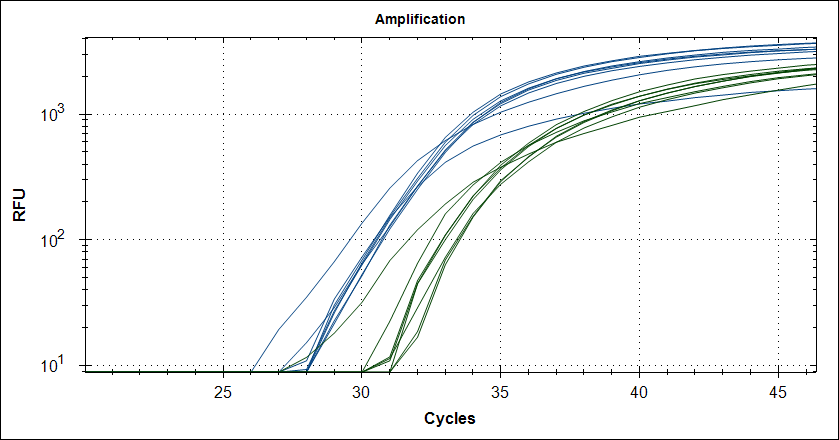
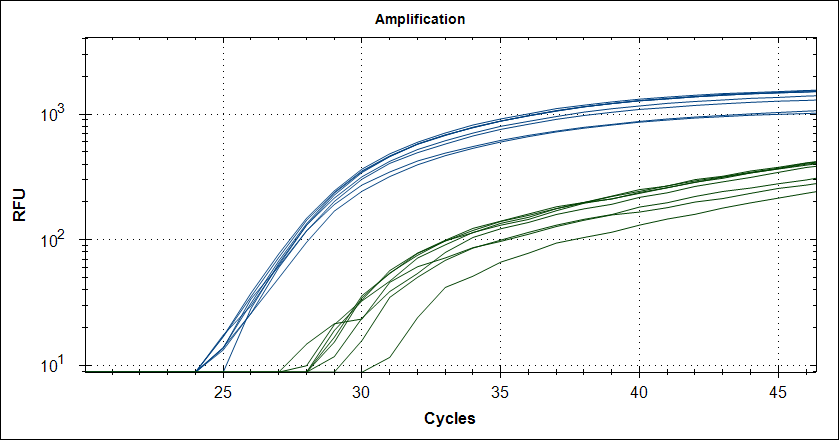
48 replicates with Taq plus 0.5µg or 1µg MAb. Blue is covid signal, green internal standard.
| 0.5µg Mab | 1µg Mab |
 |
 |
|
Cq value of 48 technical replicates |
||||
|
|
Covid |
STD |
Int.Std |
STD |
|
0.5µg Mab |
29,5 |
0,3 |
32,0 |
0,9 |
|
1µg Mab |
29,7 |
0,3 |
32,2 |
0,6 |
Links to short PDF file with data