Basic and in-depth QC of high-throughput data
For many users a basic overall evaluation of their high-throughput data is all that is needed before the user themselves analyze their data. In other cases, the user requires extensive quality control beyond what is provided by the sequencing facilities to ensure that the data is compatible with whatever downstream analysis is planned.
BCF offer both overall QC evaluations and in-depth investigations either as a stand alone project or together with downstream analyses. Examples are:
- Overall sequence quality evaluations with FastQC reports
- Mapping towards a reference genome
- Count estimations (raw) with or without normalisation (e.g. FPKM, TPM or similar)
- Goodness of fit test of counts intended for differential expression analysis
- Evaluation of 3' and 5' degradation
- Mapping coverage of different genomic features
- Library complexity
- Effect of downsampling
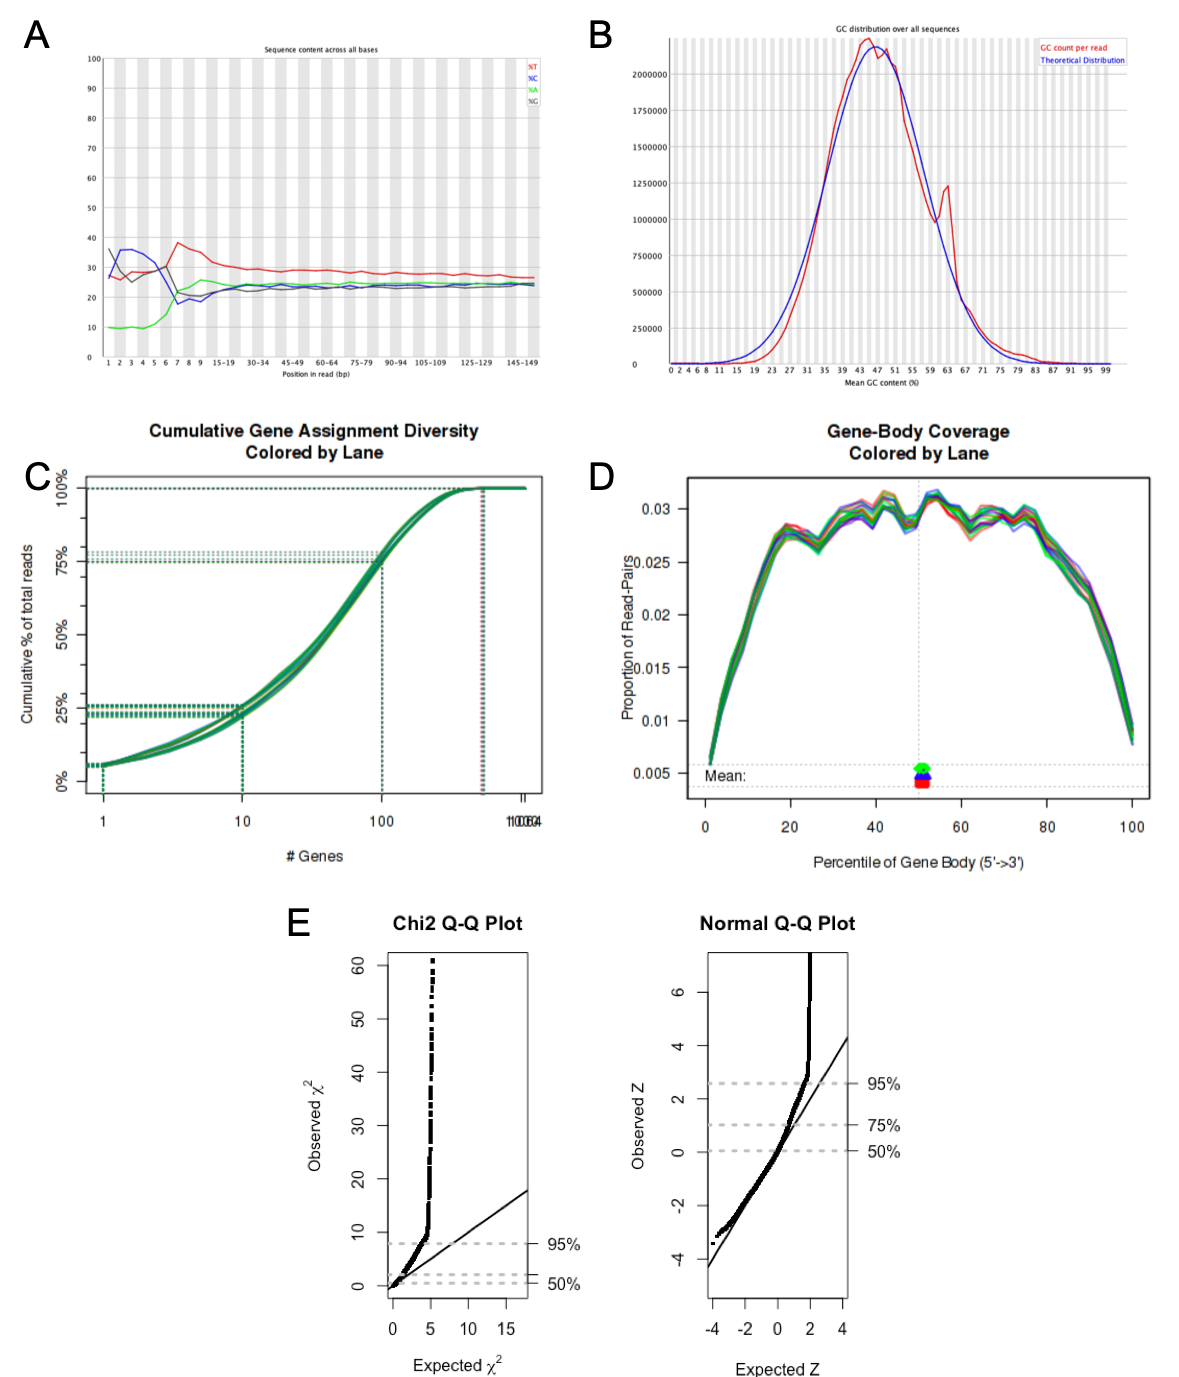
Below are examples of plots that can be obtained from various QC evaluation analysis offered by BCF. Panel A and B are parts of a FastQC report here indicating the distribution of bases across all reads and overall GC content of a sample. There is some remnants of sequencing primers shown in panel A, and a potential contamination shown by the shoulder peak in panel B. Panel C and D demonstrate the complexity of the library and level of degradation from 3' and 5' ends, respectively. Panel E is a goodness of fit test of raw counts from an RNA project where approximately 75 % of the genes have counts that varies according to the negative binomial distribution. This is a prerequisite to use most of the well established differential expression packages available today. In this particular dataset, a weighting of the data deviating from the required distribution might be required.