
Focus classification
Successful imaging depends on focus. Although our scanners and microscopes are equipped with autofocus algorithms, they frequently produce images that are partially or totally out of focus. Manual control detects many of these cases, but the manual process of checking is not only resource-demanding but also incomplete.
We have, therefore started developing a method for post imaging focus control.
Using traditional methods like computing the variance, gradient or energy of Laplacian of the images, we face the problem that the numerical values differentiating between focused and unfocused images are different for different kind of cells and tissue. Therefore, we chose an alternative approach and trained a neural network to predict an absolute measure of image focus. Not only does this method work for images of all kind of tissue, but it also has the advantage that no user-specified parameters are required.
The network is trained using images of different defocus levels. Each level is defined by applying a specific convolution to the original image, using the point spread function:
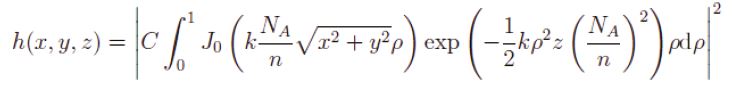
with wavelength, numerical aperture NA, refractive index n, normalisation constant C and where J0 is the zeroth-order Bessel function of first kind. Parameter z is varied in 2 um increments. Each parameters z thus defines a unique defocus level.
To train the model; we used 1161 scans of colorectal tissue; scanned with the XR scanner and a magnification of 40x. We divided the dataset into 808 cases for training: 176 cases for validation and 177 cases for testing. We tiled each of the scans into smaller images of size 512x512 pixels and converted them to grey level. We manually selected four tiles from each scan that were completely in focus; giving 3232 focused tiles for training; 704 tiles for validation and 708 tiles for testing.
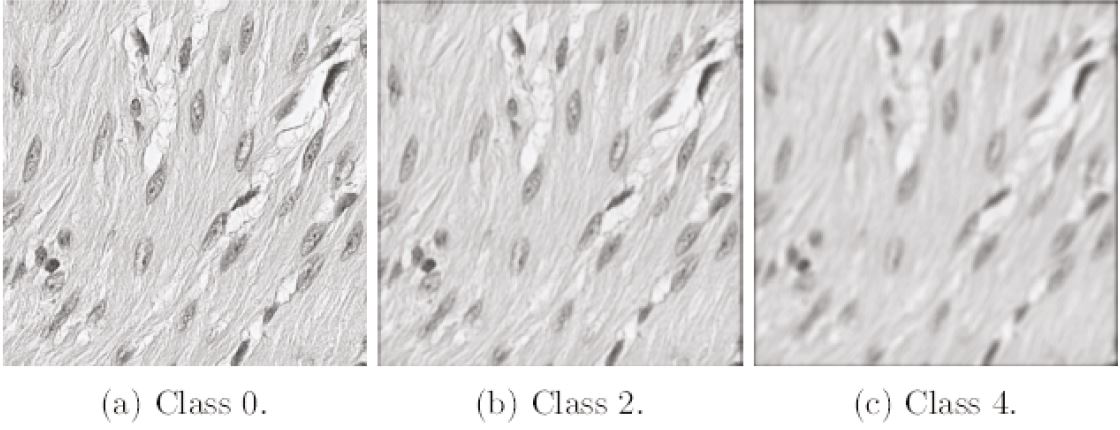
We then applied the convolution (see equation above) to the images; with k = 2; λ = 500 nm; NA = 0.5 and n = 1.0. Varying parameter z; we created seven images of different focus level from each focused original image. For classes 0 to 5; parameter z is 0, 2, 4, 6, 8 and 10 µm; respectively. Class 6 addresses images that are highly out of focus and combines several defocus levels with z = 10, 12, 14, 16, 18 and 20 µm. We tried different numbers and combinations of classes, and this number and distribution proved to give the best results for our purposes; where the main intention is to differentiate between images that are in focus and out of focus; rather than to get high accuracy in assigning the correct class for higher defocus levels. Thus, the seven classes describe increasing levels of image blur; class 0 corresponds to a completely in-focus image and class 6 to the highest degree of image blur. The complete image dataset consists of an equal number of images for each defocus level; with totally 12928 images for training; 2816 images for validation and 2832 images for testing. The total number of images is 18576.
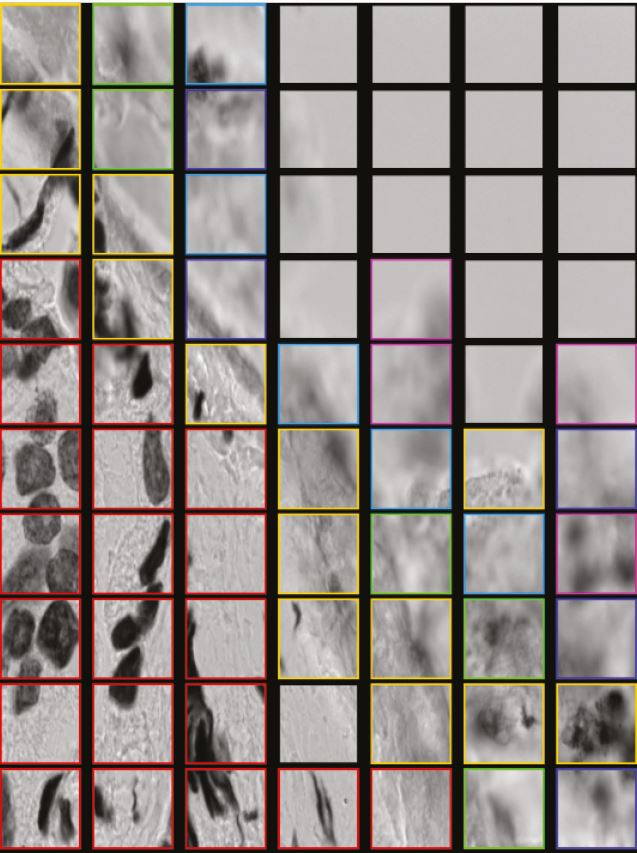
The result of the algorithm is visually presented as colour-coded tiles, with empty tiles as black (see figure "Focus classification").
In order to verify the model for the use with scans images, 5326 scans of colon polyps have been manually evaluated with respect to whether the polyp tissue is in focus. We then have compared the results with the automatic focus classification. The total number of scans is divided into 3366 Aperio scans and 1960 XR scans. Each scan contains several polyps that have been evaluated individually, totally resulting in 26549 polyps in the Aperio group and 14868 polyps in the XR group.
For the Aperio scans, we got an accuracy of 97.5%, meaning that in 97.5% of the cases, the manual and automatic evaluation agree whether a polyp is in focus. For XR, the accuracy is 94.2%. The overall accuracy is 96.5%.
We did the same kind of analysis for microscope frames. We created a dataset of 1000 frames by randomly selecting images from 10 different datasets with microscope frames from Feulgen-stained tissue sections including prostate, lung, colorectal and liver tissue. Each frame was classified both manually and automatically. Frames containing more than 50% background were omitted from the evaluation. The overall accuracy was 94.0%.
Using synthetically defocused images of different defocus levels, we have trained a network to predict the absolute measure of image focus. Unlike traditional methods, the model works equally well for all kinds of tissue, irrespective of whether the image is a grey level microscope image or a coloured scan. The prediction of focused images agrees almost totally with manual evaluation. For microscope frames, the prediction of out-of-focus images is very accurate, too, while scan images that are predicted as being out of focus still have a certain probability of actually satisfying the manual focus criteria. Our automatic focus classification thus provides a valuable tool for assisting and reducing the amount of manual work.