
Aneuploidy - Promoter and suppressor of malignant growth
Aneuploidy is a very rare and tissue-specific event in normal conditions, occurring in a low number of brain and liver cells. Its frequency increases in age-related disorders and has been recognised as a hallmark of tumorigenesis for more than a century. Still, the mechanism behind chromosomal errors and malignant growth has remained obscure.
New evidence has shown that aneuploidy is a frequent, but not a universal, driver of cancer development and can instead exert substantial tumour-suppressive effects. Rather than consider all aneuploidies as markers of malignant growth and poor prognosis, one must identify the type of aneuploidy and the context in which it either promotes or suppresses malignant growth.
Within individual cancer types, the frequency of aneuploidy can range from ~25% (thyroid carcinomas) to nearly 100% (glioblastomas). Some cancers display characteristic aneuploidy patterns; for instance, most glioblastomas gain an extra copy of chromosome 7 and lose a copy of chromosome 10. Other cancers display a very wide range of aneuploidies, which can include both clonal and subclonal alterations. Indeed, aneuploidy is a major source of intratumour heterogeneity in many different cancers. Aneuploidy frequently arises early in tumorigenesis, i.e., single-chromosome gains and losses are often found in polyps, adenomas and other precancerous lesions. However, sequencing studies have also revealed that certain chromosomal alterations, such as the gain of chromosome 7 in lung adenocarcinomas, tend to occur late in tumour development, potentially after cells have acquired prior mutations that allow them to tolerate the effects of aneuploidy. Chromosome gains and losses typically result in a proportional change in the expression of genes on an affected chromosome, leading to an increase in gene expression from trisomic chromosomes and a decrease in expression from monosomies. Finally, while the exact causes of aneuploidy remain obscure, some aneuploidies may arise from chromosomal instability (CIN), a state in which cells frequently mis-segregate whole chromosomes. It is important to note that CIN and aneuploidy are related but not identical; aneuploidy describes an imbalanced karyotype, while CIN describes a condition that accelerates the development of aneuploidy.
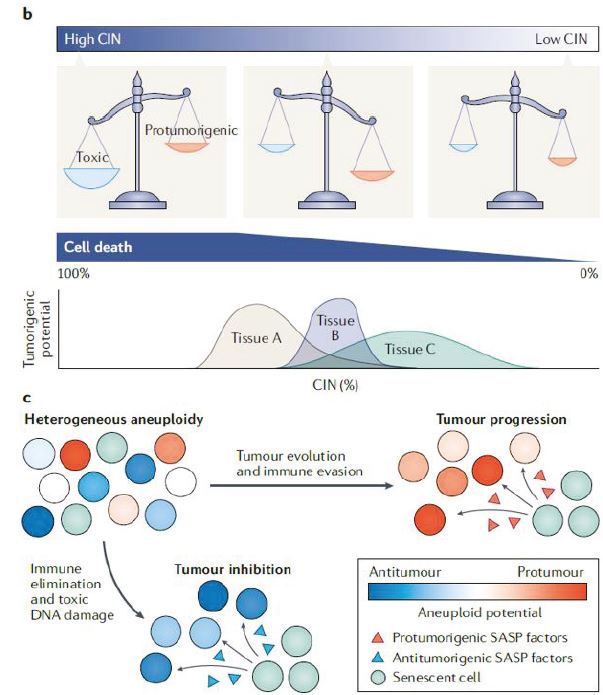
Despite the ubiquity of aneuploidy in cancer, engineered aneuploid cells typically exhibit decreased fitness and tumorigenicity. Consistent with earlier results obtained in yeast, human and mouse cells that carry a single extra chromosome exhibit a pronounced cell cycle delay, proteotoxic stress, metabolic alterations and genomic instability. Aneuploid stem cells are outcompeted by euploid stem cells in mosaic embryos and when co-injected to reconstitute the mouse haematopoietic system. Finally, aneuploid cells are resistant to transformation with oncogenes, senesce prematurely and grow poorly as tumour xenografts. In total, these results suggest that aneuploidy is, in fact, capable of functioning as a tumour suppressor.
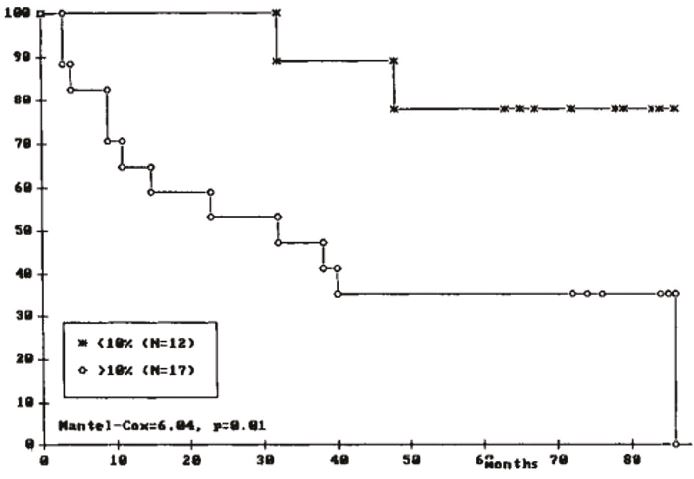
In more than 50 publications, ICGI has demonstrated that DNA aneuploidy identifies high-risk patients with significantly shorter cancer-free survival than DNA diploid patients. In a majority of these studies, DNA ploidy was shown to be an independent prognostic marker. However, in most of these studies, up to 1/3 of the patients with non-diploid tumours did not have shorter cancer-free survival than patients with apparent diploid tumours. We have also observed that hyperdiploidy (a frequently occurring type of aneuploidy in gynaecological cancers) do not seem to identify high-risk patients, and we have seen that among patients with tetraploid tumours in prostate cancer, less than half are high-risk patients. We have also observed that patients with heterogeneous aneuploidy tend to do worse than patients with homogeneous aneuploidy.
Clearly, there are other factors than ploidy determining the patient’s outcome, and it is not reasonable to expect that any biomarker will approach 100% accuracy. A correct classification rate (CCR) of around 70% is considered a strong biomarker. Hence, there have been few attempts to explain the variable effect of aneuploidy. However, recent insight opens for the possibility of subclassification of aneuploidy that might lead to an even stronger biomarker in a specific context.
Aneuploidies in low-risk vs high-risk – what is different and is this dependent on nature or nurture?
A description of aneuploid tumours where patients have experienced distinctly different outcomes seems a worthwhile exercise and one obvious study design to identify potential sub-classes of aneuploidy. The descriptors could be:
- DNA index
- Heterogeneity
- Relative cell count
- 5c exceeding rate
- Proliferative fraction and G1 delay
- Treatment
DNA index (DI) analysis
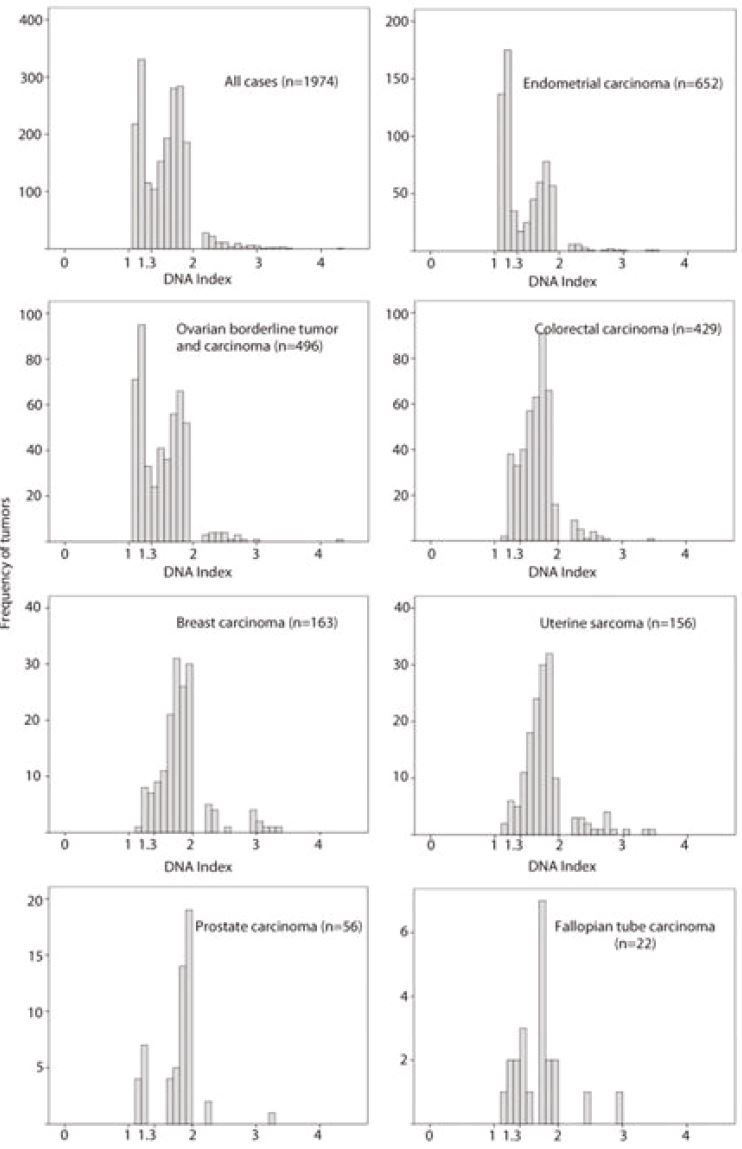
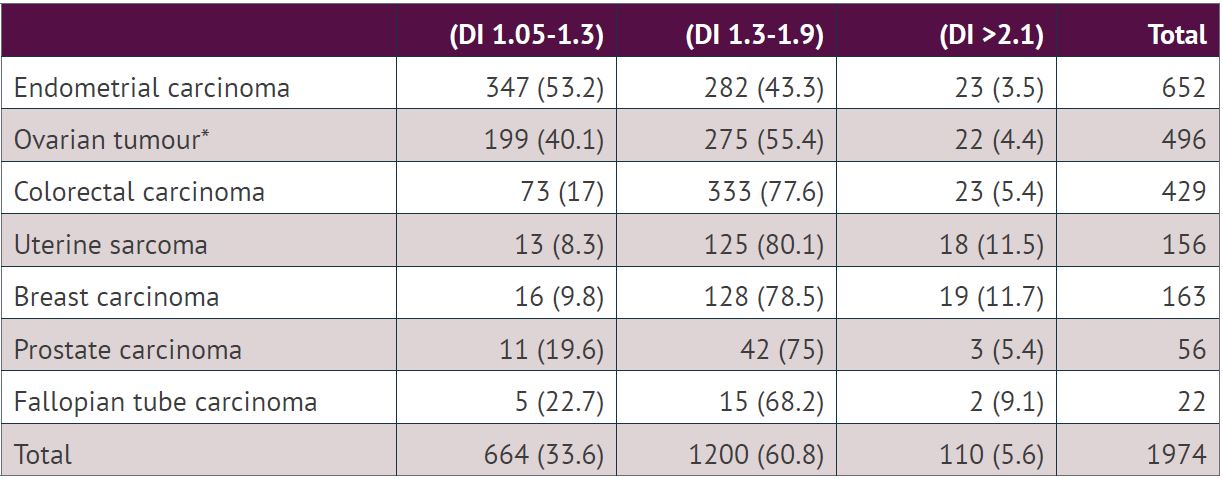
DNA index is a relative value to the position of the diploid peak, which is set at 1. A DI value around 2 and its multiple are polyploidy, and all other values indicate an aneuploid peak. DI is therefore used as a measure of the degree of polyploidy and aneuploidy and as a separate biomarker within these ploidy classes. Our previous analysis of 1974 aneuploid tumours showed that the DI ranged from 1.05 to 4.22. The histogram of DI values showed a bimodal pattern. The majority of the tumours had DI either between 1.05 and 1.30 (n= 664, 33.6%) or between 1.31 and 1.9 (n=1200, 60.8%). Based on the bimodal distribution, we have divided aneuploid tumours into two groups using a cut-off point at DI 1.3. The pattern was similar when the tumours from different locations were evaluated individually, although the proportion of tumours with DI 1.05-1.3 and DI 1.3-1.9 was different. The proportion of tumours with DI 1.05-1.3 was highest in endometrial carcinoma (53.2%) and lowest in uterine sarcoma (8.3%,). The proportion of tumours with DI <1.3 was associated with tumour type (chi-square test, p <0.001). The tumours with DI >2 (5.6%) were less frequent compared to tumours with DI between 1.05 and 1.9 (94.4%).
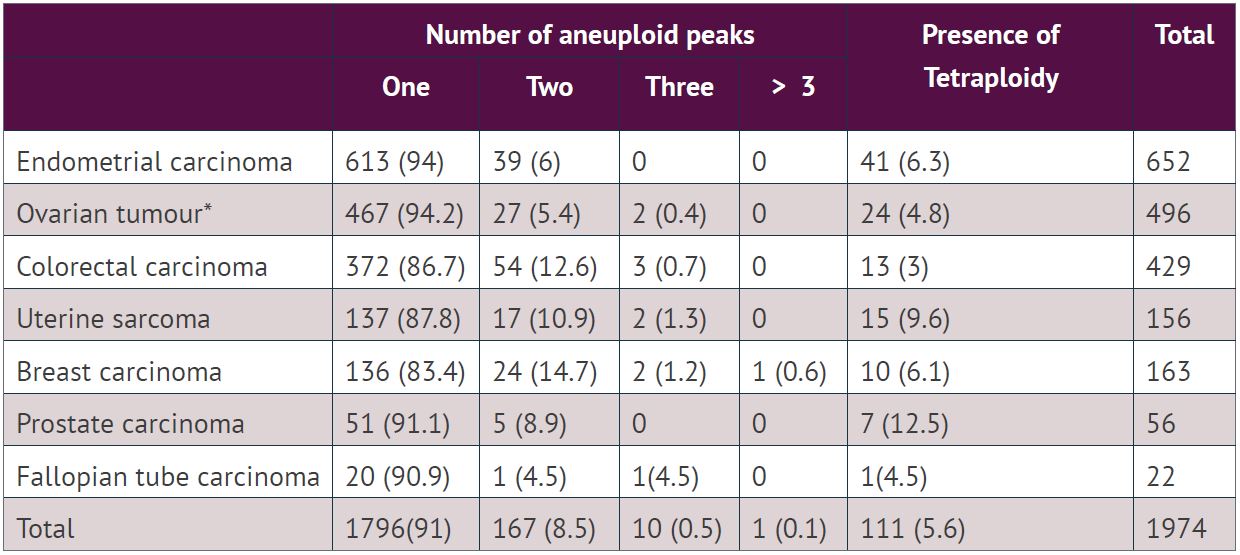
Of 1200 aneuploid tumours with DI between 1.3-1.9, an additional tetraploid peak was observed in 66 (5.5%) tumours. Similarly, out of 110 aneuploid tumours with DI >2.1, only 6 (5.5%) tumours showed an additional tetraploid peak. A single aneuploid population was observed in 1796 cases (91%), two populations in 167 (8.5%) cases, three in 10 (0.5%) cases and five in 1(0.1%) case.
Data from the literature indicate that:
- Aneuploid tumours with DI >1.3 were related to large tumour size, advanced clinical stage and high histological grade in breast carcinoma (Elie C et al. 2005)
- DI >1.3 is also reported as an independent prognostic factor in endometrial carcinoma.
- DI >1.4 has been reported as a predictor of lymph node metastasis.
- DI >1.5 was a marker of poor prognosis in patients with hepatocellular carcinoma.
- Clinical usefulness of DI is disputed. Several researchers have reported DI as a prognostic marker, but many studies failed to find the prognostic importance. In leukaemia, DI 1.16 has been reported. The cut-off point ranges from 1.16 to 1.5.
One of the aims of this project is to clarify the value and usefulness of DI as a biomarker, and DI will be determined and classified in all 30 000 cases and used to label and sub-classify aneuploid tumours. As part of this, the prognostic importance of hyperdiploid tumours will be investigated.
Homogeneous vs heterogeneous Aneuploidy
The majority of aneuploid tumours consist of one apparent population, seen in the ploidy histogram as the main peak followed by S-phase cells and a comparable G2 peak. The mean CV of aneuploid peaks (3.49, range 0.73-13.72) is similar to the CV of the diploid peaks in the aneuploid histograms (3.55, range 0.85-18.86). Although the mean CV of both diploid and aneuploid peaks were low, the range was relatively large in both cases. Whether this range is an expression of real variation in chromosome numbers or simply a variation in the quality of DNA and measurements is unclear. However, one always sees an increase in the CV over time, i.e., freshly prepared cases have a lower CV than archive samples, and variation in time, fixation and preservation of the tissue will introduce variations in the CV.
The DI of the aneuploid populations ranged from 1.05 to 4.22, around 9% of the aneuploid tumours had two or more aneuploid peaks and some peaks have a CV that could indicate multiple populations within the peak. One of the aims will be to investigate to what extent this heterogeneous aneuploidy is related to the outcome for the patient.
Relative amount of aneuploid cells
Although with conflicting data, there has long been data supporting the reasonable assumption that the relative amount of aneuploid cells in a tumour is related to patient outcome. However, most of these studies are carried out with small groups of patients, arbitrary thresholds and without proper validation.
Hence, the correlation between large cell fraction and poor prognosis is unclear at best. A properly designed analysis with an optimal threshold defined in a training set and an independent validation using our ploidy cohorts should finally conclude this matter.
5cER – does it matter?
Several studies, including our own, have demonstrated that very small fractions of aneuploid cells indicate a poor outcome for cancer patients if the DNA content is 5-times or more than in diploid cells. It is common practice to classify a sample as aneuploid if this fraction, 5c exceeding rate (5cER) is higher than 1% of the total population of epithelial cells. These 5cER observations are not frequent, however, and hence the data supporting this practice are scarce. One of the aims of this project is to present an analysis based on sufficient numbers of 5cER observations in an attempt to validate this as a pan-cancer biomarker.
Proliferative fraction
The observations made in 1974 aneuploid tumours from 7 different tissues (table 13) indicate that although aneuploidy might be caused by and co-exist with chromosomal instability (CIN), most aneuploid populations are most likely monoclonal and fairly stable (assuming an equal size of all chromosomes, a CV of 3,5% would hide a variation of around 1.6 chromosomes). This is an enigma in tumorigenesis, as one would expect these aneuploid cells to be proliferative and not be able to segregate chromosomes accurate enough and seemingly independent of chromosome numbers. It is a fact that aneuploid cells have a growth disadvantage compare to diploid cells, and this is partly explained by the fact that a general feature of the aneuploid condition is G1 delay. They enter the mitotic phase less frequently, but another factor might be that mitosis more frequently results in only one or no surviving daughter cells.
The DNA ploidy histogram also allows for estimations of the S-phase and G2-phase of each DNA population. The DNA ploidy data from our multiple large cohorts should allow us to produce more decisive data on G1 delays and proliferative activity in different ploidy populations.
Susceptibility to radiation or chemotherapy
We have previously observed that patients with aneuploid bladder cancers lived longer than patients with euploid cancers after radiation therapy, indicating that aneuploid tumours are more susceptible to radiation than diploid tumours. This finding has been confirmed by others, also in cervical carcinoma.
Paradoxically, aneuploidy is associated both with poor prognosis in cancer and with slow growth in primary cells. These two seemingly contradictory observations are bridged by the observations of Replogle et al. (PNAS 117(48)30556-30576, 2020) that the cell cycle defects caused by aneuploidy protect cancer cells from chemotherapeutic damage.
In our cohorts, we have ploidy- and survival data on comparable patient groups with and without chemotherapy and we should be able to put these observations to the test.
Materials
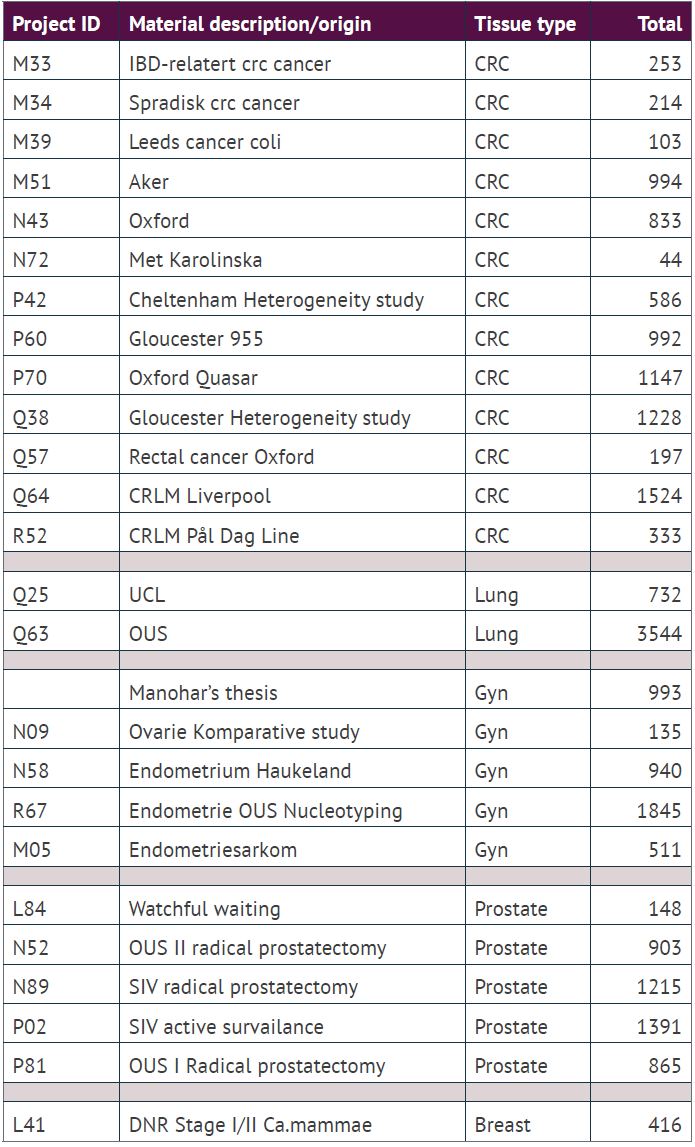
From the many ploidy studies and our clinical ploidy work over the last two decades, ICGI has amassed a biobank of DNA ploidy analysis of solid tumours from around 32 000 patients, mostly from cancers in the colon, rectum, lung, prostate, endometrium, and ovaries, i.e., representative of more than 50% of all human cancers. Around 10 000 of these cases are from our clinical routine, and the remaining 22 000 are from previous and current research projects.
In order to merge cohorts, nuclear images from all cases will be re-measured with the most recent version of our ploidy software (PWS, Room4 Group Ltd, Essex, UK). We changed the hardware platform in 2012, so there will be two different rule files in use for cell classification with slightly different corrections for dark current and glare. All histograms will be normalised using the position (DI=1) for the diploid peak of the internal control cells.