
Mitotic index
Mitotic Index (MI) is defined as the ratio between the number of cells in a population undergoing mitosis to the total number of cells in a population.
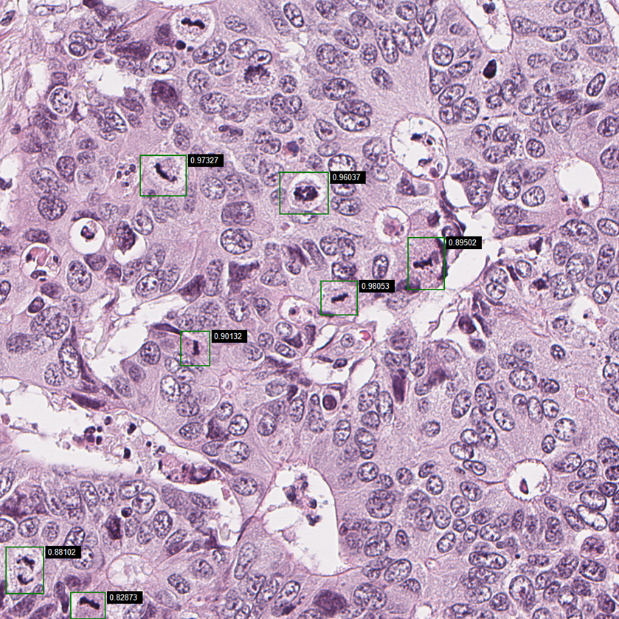
An elevated mitotic index indicates more cells are dividing and is an important prognostic factor predicting both overall survival and response to chemotherapy in most cancer types. A convolutional neural network (CNN) was developed for the detection of mitotic figures in whole slide images (WSIs) of haematoxylin and eosin (HE) sections based on a publicly available breast cancer dataset with manually annotated mitotic cells from the “Tumour Proliferation Assessment Challenge 2016”. The method was implemented in our windows-based image viewer, SeeMore. We currently have ongoing or scheduled studies of Mitotic Index in several clinical cancer materials.
Initial method and application development
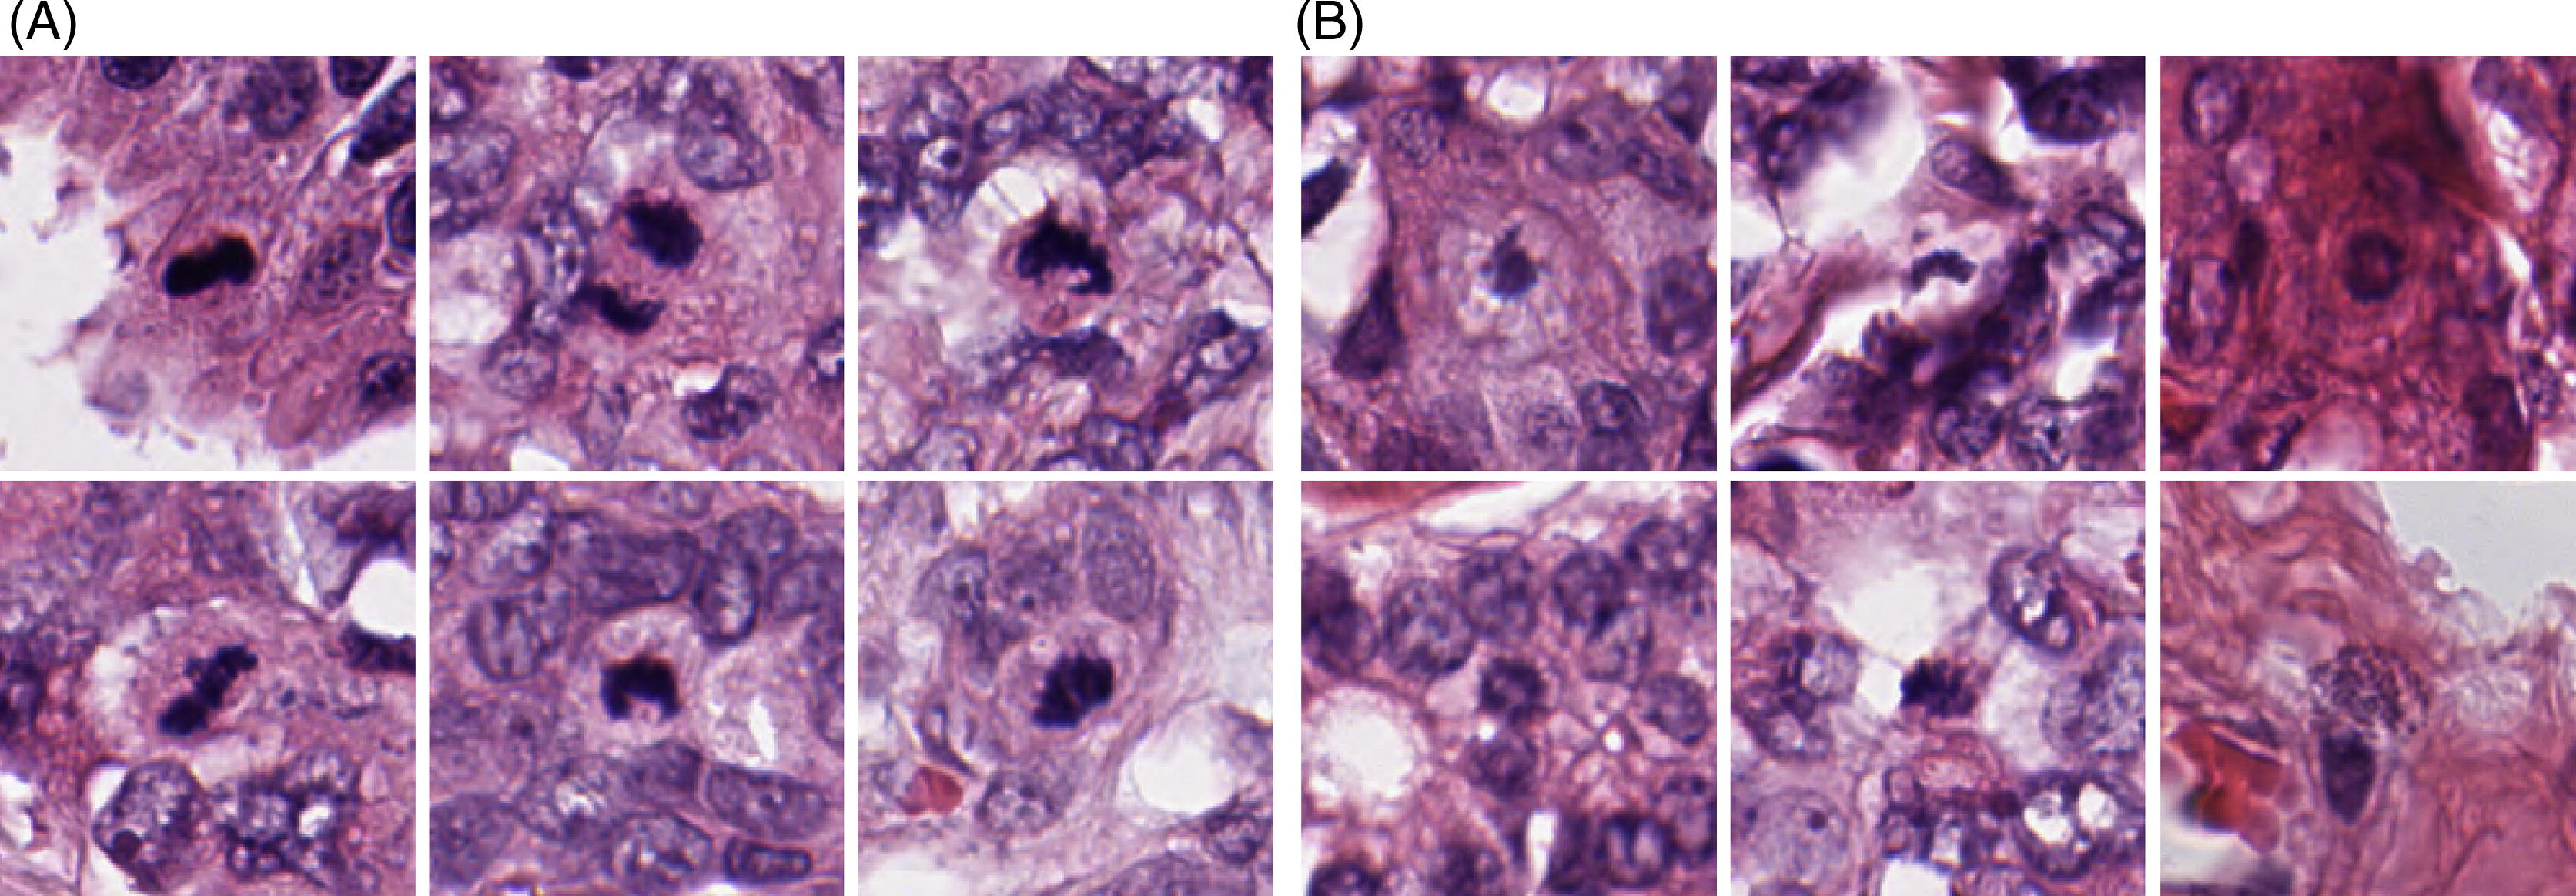
A convolutional neural network, Fast R-CNN, was trained to detect mitotic figures in whole slide images (WSIs) of HE sections. The algorithm was developed using 73 WSIs from a publicly available breast cancer dataset with manually annotated mitotic cells from the Tumor Proliferation Assessment Challenge 2016 (TUPAC). After successful training and tuning, the algorithm was tested on a total population cohort of uterine sarcomas where we could evaluate the association between the mitotic figure frequency and patient outcome, and correspond results with pathologists’ mitotic figure counting. The method is implemented in our windows-based image viewer, SeeMore, that allows both sample analysis and visual inspection of the result. The application counts the number of mitotic cells per field (defined as 1024x1024 pixels in images from the scanner at a 40x lens setting). Hence, it is not providing Mitotic Index but the relative number of mitoses in each sample. This is in line with how pathologists report mitotic index: the number of cells undergoing mitosis in a region of fixed size (often ten high power fields). The results are given numerically as mitotic figures per mm2 and visualised with annotations on the WSI.
We have evaluated our automatic method’s performance in a total population of uterine sarcomas, where pathologist Vera Abeler manually counted mitotic figures (Abeler et al., 2009). We found a particularly good correlation between manual and automated counts and found the prognostic impact to be strong.
Due to advances in methodology for object recognition and a suboptimal training setup, we decided to retrain the method with state-of-the-art methods for object detection, i.e., Faster R-CNN, Mask R-CNN, Single Shot Detector and Yolo v5 and have trained Faster R-CNN and Mask R-CNN. The results, based on the F1-score and mean average precision (mAP), are promising. The best algorithm for mitotic figure detection will be selected based on the results of the test partition of the TUPAC development dataset within each category of models. The best model (among the best models within each model category) for mitotic figure detection will then be selected using the test set uterine sarcomas (M05). The mitotic figure will be represented as quartiles, and continuous variables and concordance index used to evaluate the prognostic impact on overall survival (primary analysis) and correlation analysis (Spearman) to evaluate the correspondence with manually assessed mitotic figure counts.
Validation studies
Mitotic Index will be determined in seven clinical cancer materials, with more than 15000 tumour samples from 6700 patients.
In addition to uterine sarcomas, preliminary results indicate that MI is also a significant prognostic marker for patients with prostate cancer, lung cancer, and CRC liver metastasis but not for patients with primary colorectal cancer (CRC). The purpose of this project, in addition to establishing new prognostic markers, is to position MI as a fully automated method applied to all histological sections in routine digitalized pathology.
Further work on Mitotic Index
The application should also count the number of nuclei per field in order to adhere to the definition of Mitotic Index. Both the relative number of mitosis and the Mitotic Index should be reported in future versions of the application. This requires a robust method for the identification of cells, and we intend to utilise published methods if they are sufficiently accurate for our needs. If not, a training set will be constructed through manual annotations, and a CNN algorithm will be developed for this purpose.
The training set contains a number of questionable mitotic figures that might be pyknotic nuclei (condensation of chromatin in a cell undergoing necrosis or apoptosis), so we will attempt to further improve the training by adding images of mitotic figures classified more accurately. Among the tasks is the development of an application that allows fast manual classification of potential mitotic figures to refine and extend the ground truth dataset used to develop the automatic method. The clustering of mitosis displayed in the application needs to be quantified. This task will be implemented in a separate project, where the aim is to study the extent and impact of clustered mitotic activity.
The correlation between automatically assessed mitotic index and antibodies detecting mitosis (pHH3) will be studied in a project on stage I lung cancer adenocarcinomas. This study will provide information about the accuracy of the mitotic index method and based on our findings; we may retrain our method using data from this approach. Immunohistochemistry with automated scoring of protein expression provides objective measures where we relatively easily can obtain large amounts of ground truth data for training of new neural network models.