Functional cellular, explant - and organoid systems
We study how the expression of genes is regulated in cells by non-coding RNAs like miRNAs, lncRNAs, splicing and DNA methylation.
Are miRNA differently expressed between tumors sensitive or resistant to a certain chemotherapy treatment?
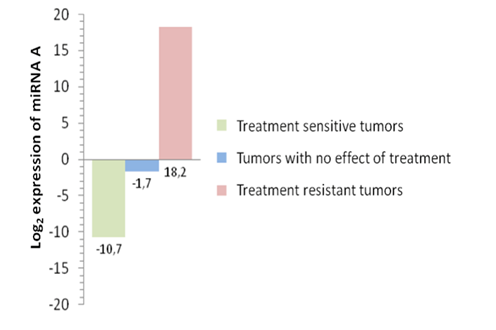
Figure 1.Expression of miRNA “A” analyzed by microarray in breast cancer tumors after chemotherapy treatment. Treatment sensitive tumors show a down-regulation of miRNA “A”. Tumors with no effect of the treatment show a not significant down-regulation of miRNA “A”, while the treatment resistant tumors show an up-regulation of the miRNA (unpublised).
Do miRNA change protein levels?
Adding miRNA precursors or miRNA inhibitors we measure the effect on mRNA level (qPCR/expression arrays) and the protein level (western blot/Peggy Sue simple western)
 a miRNA precursor, 2) a miRNA inhibitor for the certain miRNA (anti-miR) and 3) a siRNA knocking down the protein of interest. The miRNA is in silico predicted to regulate the expression of a certain protein and the protein expression is analyzed using capillary western blotting (Peggy Sue, Proteinsimple, Biotechne). Blue curve show protein expression in not transfected cells, green curve show the protein expression in cells transfected with miRNA")
Figure 2 A and B. Protein lysates from human breast cancer cells are transfected with 1) a miRNA precursor, 2) a miRNA inhibitor for the certain miRNA (anti-miR) and 3) a siRNA knocking down the protein of interest. The miRNA is in silico predicted to regulate the expression of a certain protein and the protein expression is analyzed using capillary western blotting (Peggy Sue, Proteinsimple, Biotechne). Blue curve show protein expression in not transfected cells, green curve show the protein expression in cells transfected with miRNA "B", grey curve show protein expression in cells transfected with a miRNA "B" inhibitor (anti-miR), whilst the pink curve show the protein expression knock-down by siRNA. AU545 is a ER-/PR-/Her2+ human breast cancer cell line (A) and BT-20 is a ER-/PR-/Her2- basal like human breast cancer cell line (B) (unpublised).
Does overexpression ofmiRNA influence vital functions of the cells?
 and assayed for (a) cell proliferation (Ki67), (b) phosphorylated AKT (p-AKT) levels, (c) cell viability and (d) apoptosis (cleaved PARP (cPARP)), 72 hours after transfection. The dashed lines indicate cut-off points that were considered significant. Asterisks denote significant effects. The data for cell viability are from two replicate experiments with error bars showing standard deviations.")
Figure 3. In-cis miRNAs show functional effects when overexpressed. Breast cancer cell lines were transfected with miRNA mimics (20 nM) and assayed for (a) cell proliferation (Ki67), (b) phosphorylated AKT (p-AKT) levels, (c) cell viability and (d) apoptosis (cleaved PARP (cPARP)), 72 hours after transfection. The dashed lines indicate cut-off points that were considered significant. Asterisks denote significant effects. The data for cell viability are from two replicate experiments with error bars showing standard deviations. From Individual and combined effects of DNA methylation and copy number alterations on miRNA expression in breast tumors. Genome Biol. 2013; 14(11): R126. Published online 2013 Nov 20. doi: 10.1186/gb-2013-14-11-r126 PMCID:PMC4053776
Are miRNA-protein associations functionally validated?

Figure 4. miRNA-protein associations validated by cell line functional assessment. Individual miRNAs were overexpressed in the MDA-MB-231 breast cancer cell line and the effect on protein expression was assessed. Shown are miRNA-protein associations that were both estimated based on patient data and confirmed with in vitro cell line experiment. The numbers in the white boxes represent protein cluster number in cases where several proteins share miRNA associations. Red lines indicate positive associations and blue lines negative associations. Yellow nodes represent miRNAs and blue nodes represent genes/proteins. From Integrated analysis reveals microRNA networks coordinately expressed with key proteins in breast cancer. Genome Med. 2015; 7(1): 21. Published online 2015 Feb 2. doi: 10.1186/s13073-015-0135-5 PMCID:PMC4396592
How do changes in methylation status affect the gene expression in cell lines?
Cells are treated with 5’Aza to inhibit DNA methyltransferase activity, or the cells are transfected with a luciferase reporter vector containing the methylated/unmethylated sequence to investigate a more specific region of interest. Pyrosequencing is used to monitor the methylation status (fig. 5A) and the gene expression levels are analyzed by qPCR (fig.5B) or expression arrays.
 Monitoring the effect of 5’Aza on methylation levels in cell lines by Pyrosequencing. Both cell line 1 and 2 show minor effect of 5’Aza treatment in the analyzed region. B) Analysis of the effect of 5’Aza on expression of a gene by qPCR. Cell line 1 show no induces expression of the gene, while for cell line 2 the gene is slightly more expressed after 5’Aza treatment (unpublised).")
Figure 5. A) Monitoring the effect of 5’Aza on methylation levels in cell lines by Pyrosequencing. Both cell line 1 and 2 show minor effect of 5’Aza treatment in the analyzed region. B) Analysis of the effect of 5’Aza on expression of a gene by qPCR. Cell line 1 show no induces expression of the gene, while for cell line 2 the gene is slightly more expressed after 5’Aza treatment (unpublised).
In addition, functional studies on cell lines are used to investigate effects of mutations and differential splicing - and also how the cells reacts on exposure to chemotherapeutic agens or radiation.
How we can apply nanomedicine in treatment of breast cancer?
Nanomedicine is simply the application of nanotechnologies in a healthcare setting and the majority of benefits that have already been seen involve the use of nanoparticles to improve the behaviour of drug substances.

Figure 6. The different structures of nanomedicines and their approximate sizes.
Nanomedicine has applied nanotechnology in various medical fields such as imaging, diagnosis and therapy in human diseases. Nanomedicine produces “nanoparticle-based drugs” simultaneously capable of the diagnosis and treatment of a disease. The goals of nanomedicine, therefore, are not only to improve the detection and to increase the efficacy of the treatment of cancers but also to limit the systemic toxicity associated with this treatment. It is, therefore, important that the therapeutic agents reach and can be concentrated on the target sites. Indeed, the advanced nanomedicines conjugated with targeting moiety can recognize specific target, bind and be internalized via specific mechanism e.g., receptor mediated endocytosis.

Figure 7. Role of nanomedicine in cancer treatment.
Project members:Miriam Ragle Aure, Xavier Tekpli, Thomas Fleischer, Marie Elise Engkvist, Grethe I. G. Alnæs,Enrico Catalano
Previous members: Espen Enerly and Stefan Kusch
External colaborators:
- Toni Hurtado, NCMM, Oslo http://www.med.uio.no/ncmm/om/organisasjon/forskergrupper/hurtado-gruppen/
- Ragnhild Eskeland, UiO, Oslo http://www.mn.uio.no/ibv/english/research/sections/bmb/Research%20groups/gabrielsen-group/chromatome-team/
- Phillippe Collas, IMB, UiO http://www.collaslab.net/
Recent publications: